The Great Pacific Garbage Patch
The Great Pacific Garbage Patch is the largest accumulation of ocean plastic in the world and is located between Hawaii and California. Scientists of The Ocean Cleanup have conducted the most extensive analysis ever of this area.
What is the great pacific garbage patch?
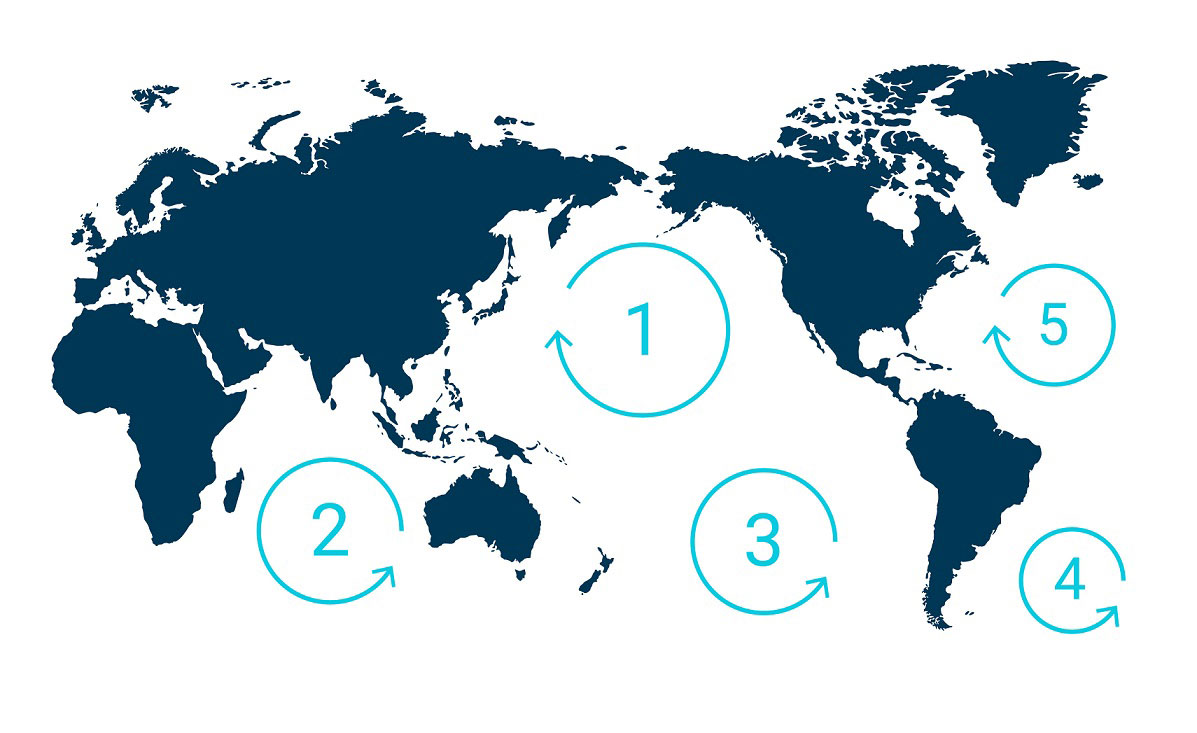
The Great Pacific Garbage Patch (GPGP) is the largest of the five offshore plastic accumulation zones in the world’s oceans. It is located halfway between Hawaii and California in the Pacific Ocean.
PLASTIC ACCUMULATION
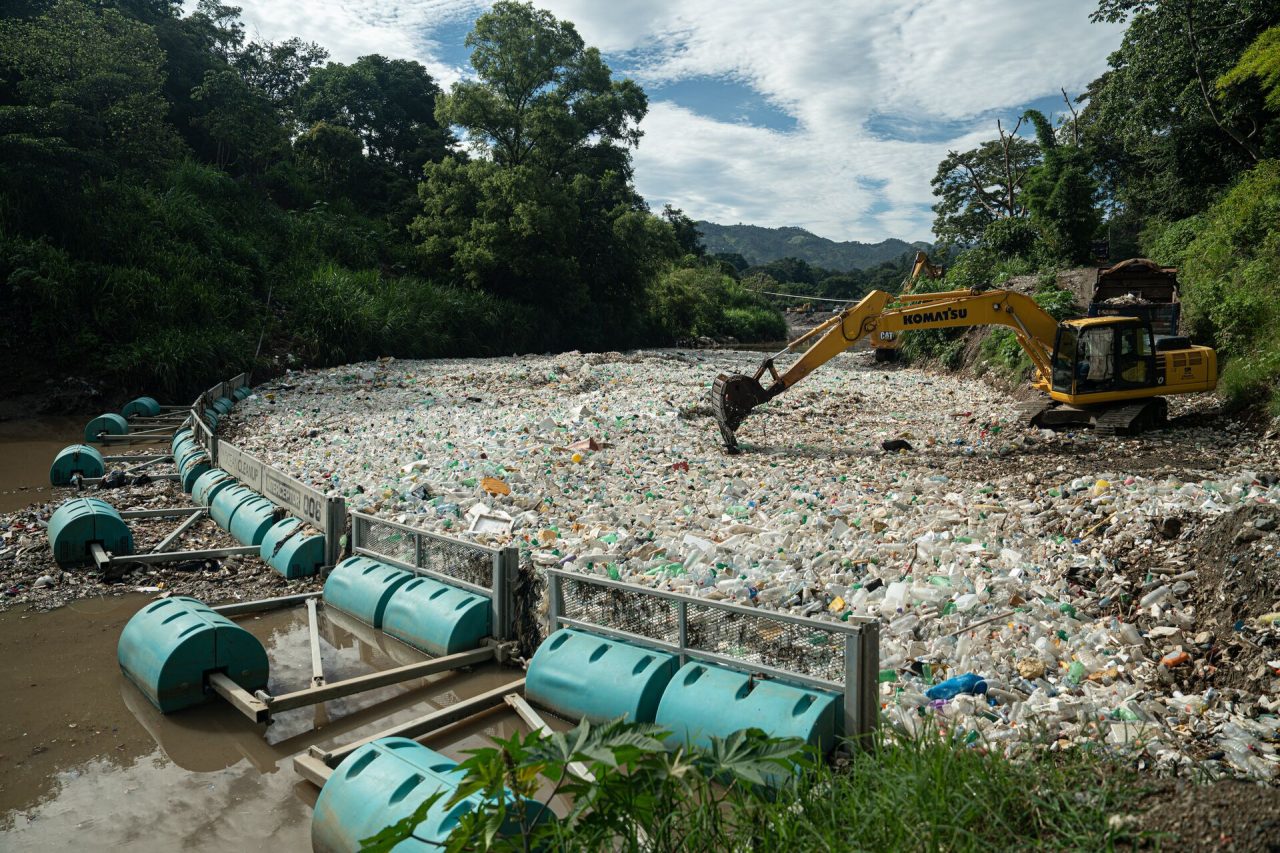
It is estimated that 1.15 to 2.41 million tonnes of plastic are entering the ocean each year from rivers. More than half of this plastic is less dense than the water, meaning that it will not sink once it encounters the sea.
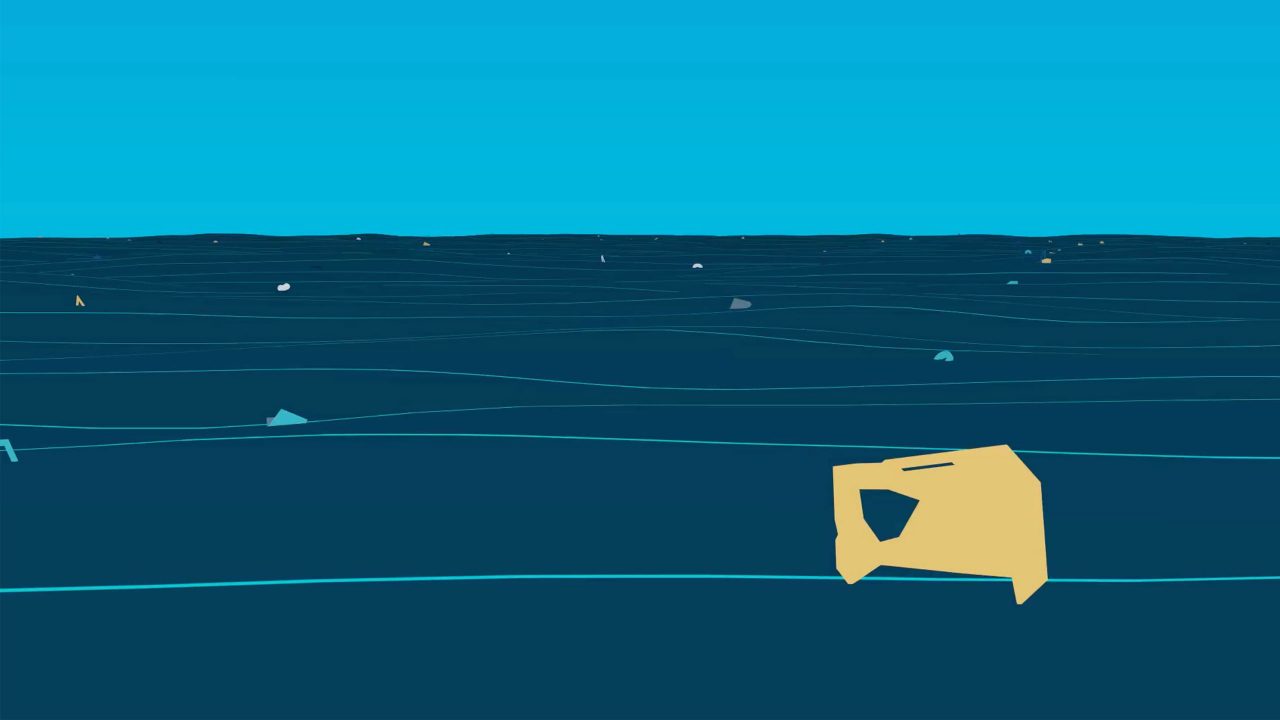
The stronger, more buoyant plastics show resiliency in the marine environment, allowing them to be transported over extended distances. They persist at the sea surface as they make their way offshore, transported by converging currents and finally accumulating in the patch.
Once these plastics enter the gyre, they are unlikely to leave the area until they degrade into smaller microplastics under the effects of sun, waves and marine life. As more and more plastics are discarded into the environment, microplastic concentration in the Great Pacific Garbage Patch will only continue to increase.
ESTIMATION OF SIZE
The GPGP covers an estimated surface area of 1.6 million square kilometers, an area twice the size of Texas or three times the size of France.
To formulate this number, the team of scientists behind this research conducted the most elaborate sampling method ever coordinated.
This consisted of a fleet of 30 boats, 652 surface nets and two flights over the patch to gather aerial imagery of the debris.
Sampling at different locations within the same time period allowed a more accurate estimate of the size of the patch and the plastic drifting in it.
LOCATION
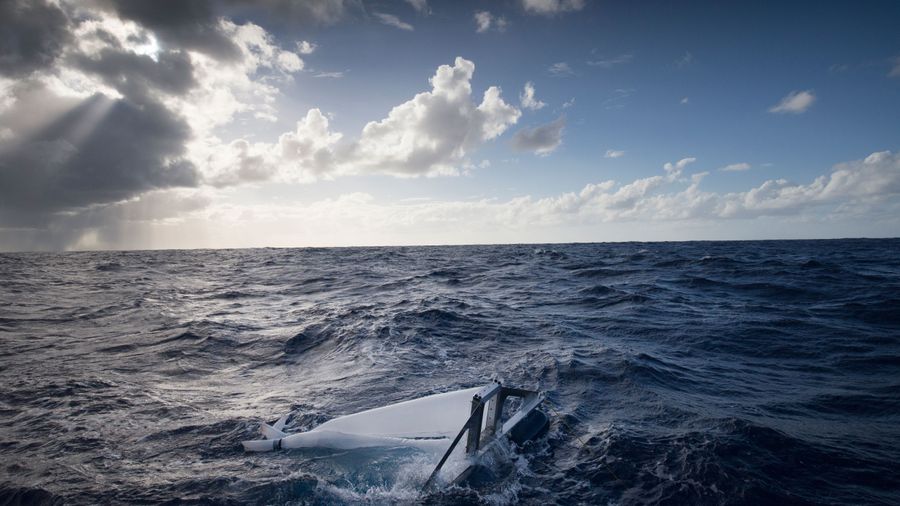
Due to seasonal and interannual variabilities of winds and currents, the GPGP’s location and shape are constantly changing. Only floating objects that are predominantly influenced by currents and less by winds were likely to remain within the patch.
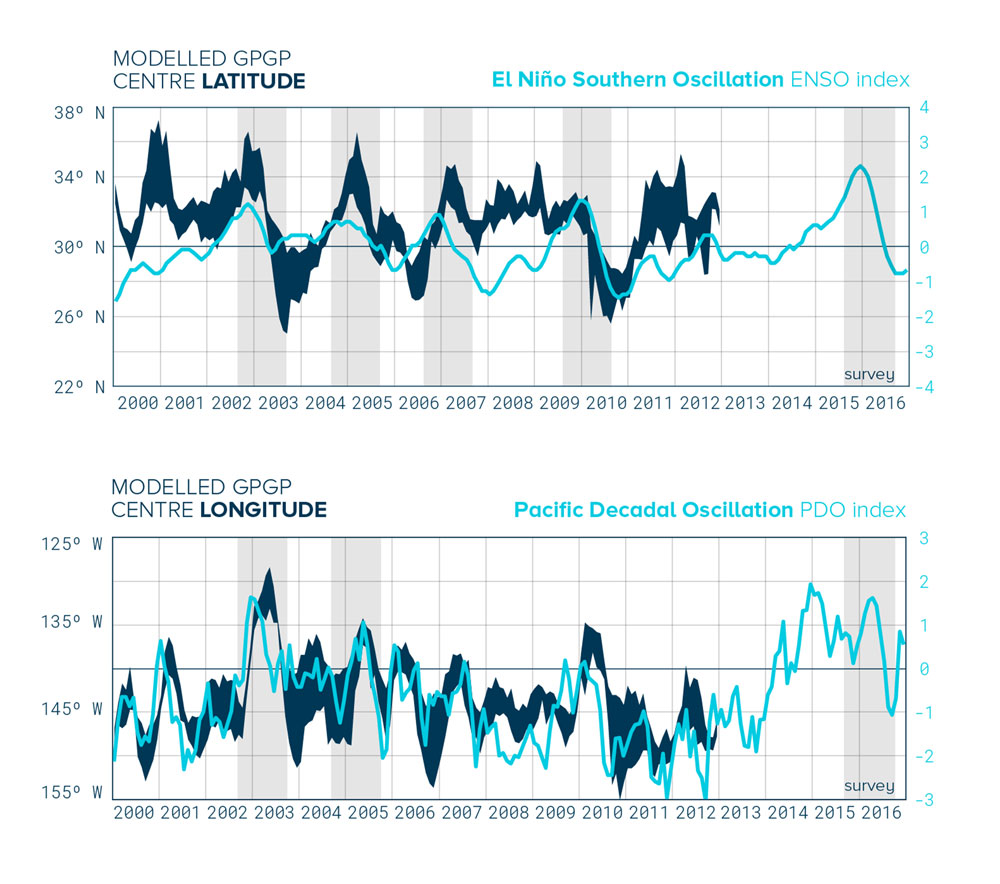 By simulating concentration levels in the North Pacific, the researchers were able to follow the location of the patch, demonstrating significant seasonal and interannual variations. On average the patch orbits around 32°N and 145°W. However, the team observed seasonal shifts from west to east and substantial variations in latitude (North to South) depending on the year.
Test your knowledge
How much plastic floats in the great pacific garbage patch?
At the time of sampling, there were more than 1.8 trillion pieces of plastic in the patch that weigh an estimated 100,000 tonnes. These figures are much higher than previous calculations.
TOTAL MASS AND COUNT
The mass of the plastic in the Great Pacific Garbage Patch (GPGP) was estimated to be approximately 100,000 tonnes, which is 4-16 times more than previous calculations. This weight is also equivalent to more than 740 Boeing 777s.
The center of the GPGP has the highest density and the further boundaries are the least dense.
 A total of 1.8 trillion plastic pieces were estimated to be floating in the patch – a plastic count that is equivalent to 250 pieces of debris for every human in the world.
Using a similar approach as they did when figuring the mass, the team chose to employ conservative estimations of the plastic count. While 1.8 trillion is a mid-range value for the total count, their calculations estimated that it may be range from 1.1 to up to 3.6 trillion pieces.
Concentration
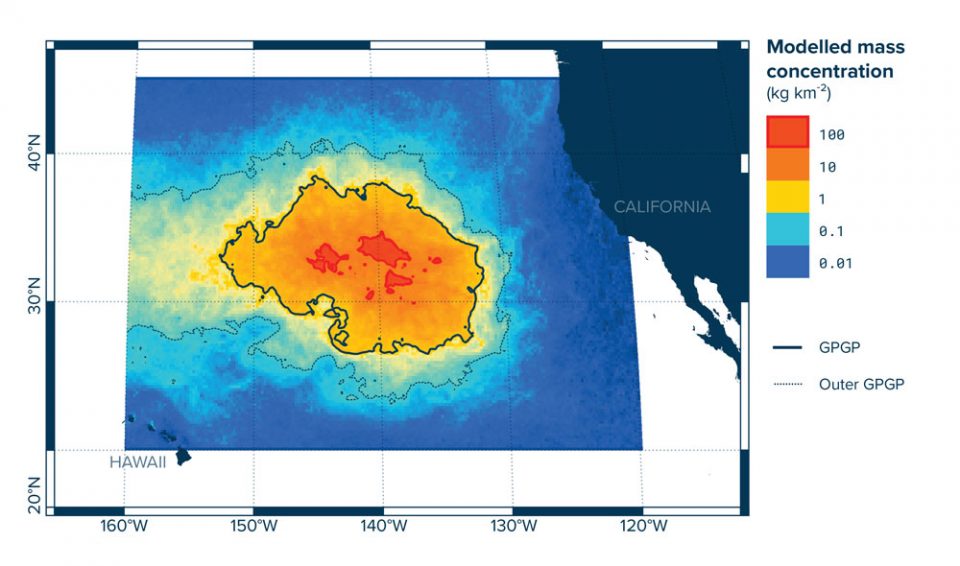
Using data from multiple reconnaissance missions, a mass concentration model was produced to visualize the plastic distribution in the patch.
The mass concentration model, pictured below, shows how the concentration levels gradually decrease by orders of magnitude towards the outside boundaries of the GPGP. The center concentration levels contain the highest density, reaching 100s of kg/km² while decreasing down to 10 kg/km² in the outermost region.
These results prove that plastic pollution at sea, while densely distributed within the patch, is scattered and does not form a solid mass, thus demystifying the trash island concept.
Vertical distribution
The Ocean Cleanup measured the vertical distribution of plastic during six expeditions between 2013 to 2015. Results from these expeditions proved that the buoyant plastic mass is distributed within the top few meters of the ocean.,
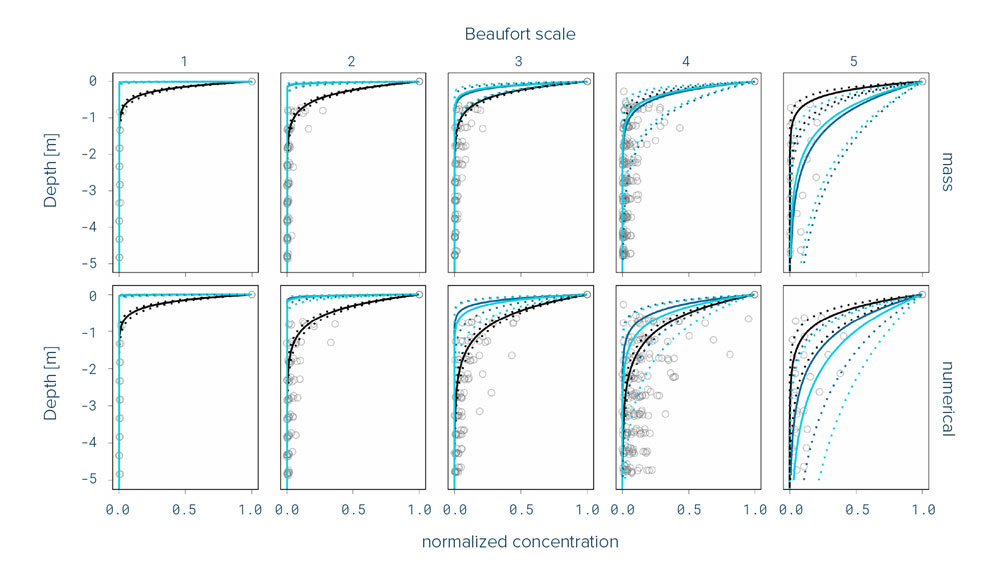
Factors such as wind speed, sea state, and plastic buoyancy will influence vertical mixing. However, buoyant plastic will eventually float back to the surface in calmer seas. Larger pieces were observed to resurface much more rapidly than smaller pieces.
Persistency
Characteristics of the debris in the Great Pacific Garbage Patch, such as plastic type and age, prove that plastic has the capacity to persist in this region.
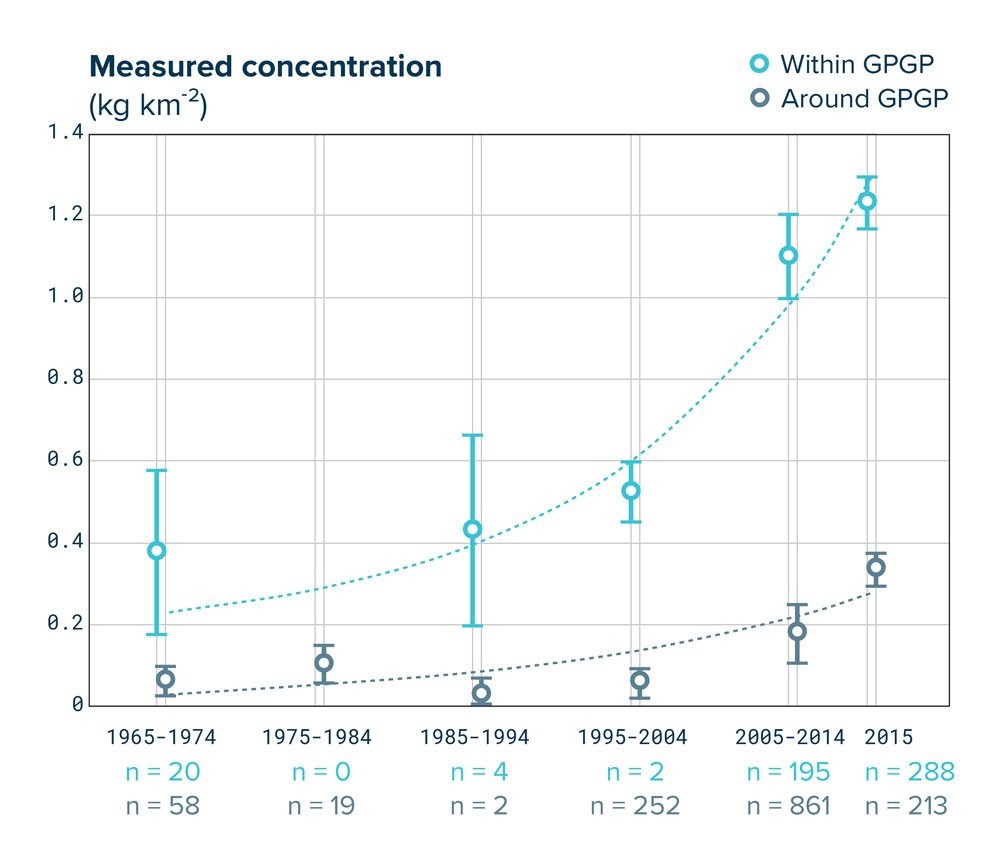
Plastic in the patch has also been measured since the 1970’s and the calculations from subsequent years show that microplastic mass concentration is increasing exponentially – proving that the input of plastic in the patch is greater than the output. Unless sources are mitigated, this number will continue to rise.
-
System 03
Our Ocean SystemThe Ocean Cleanup has been cleaning up the Great Pacific Garbage Patch with System 03.
Learn more -

Support
the
cleanupHelp fund our scale-up and let’s make the Great Pacific Garbage Patch a thing of the past
Donate
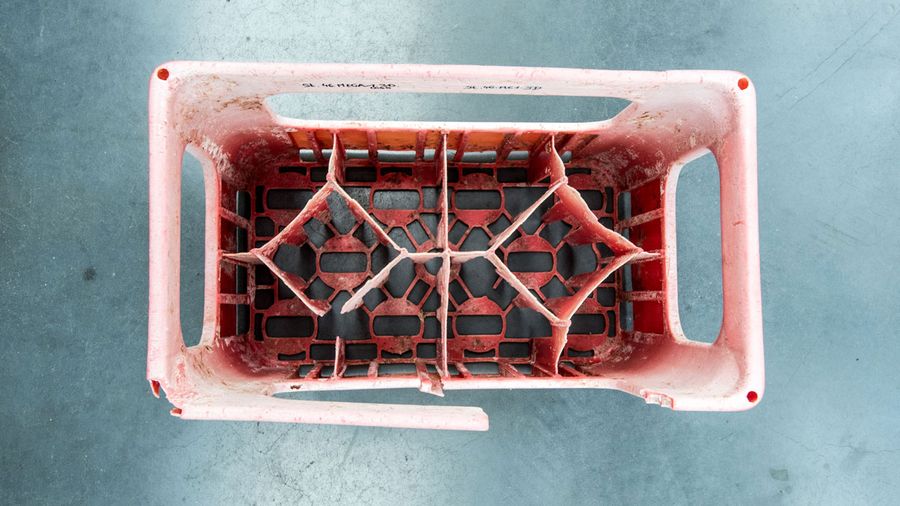
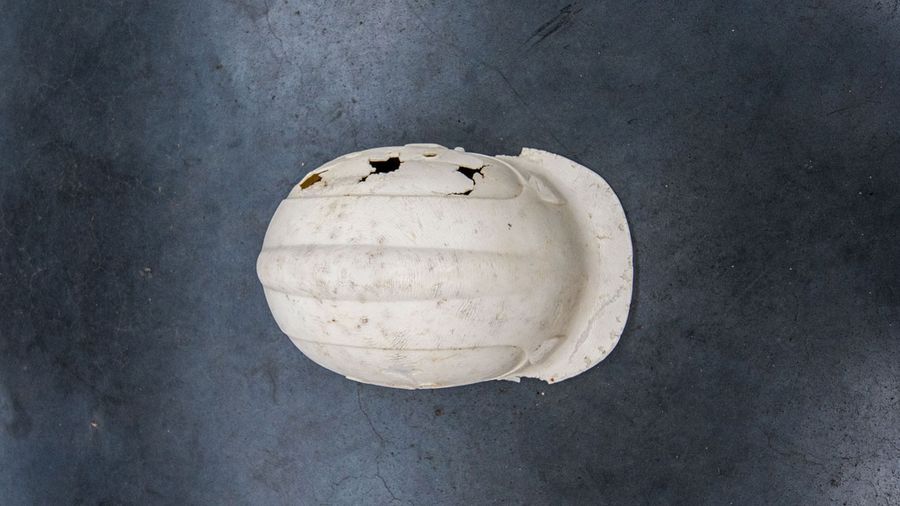
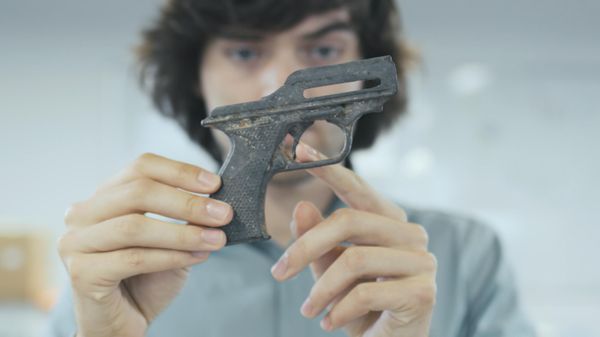
What types of plastic float in the Great Pacific Garbage Patch
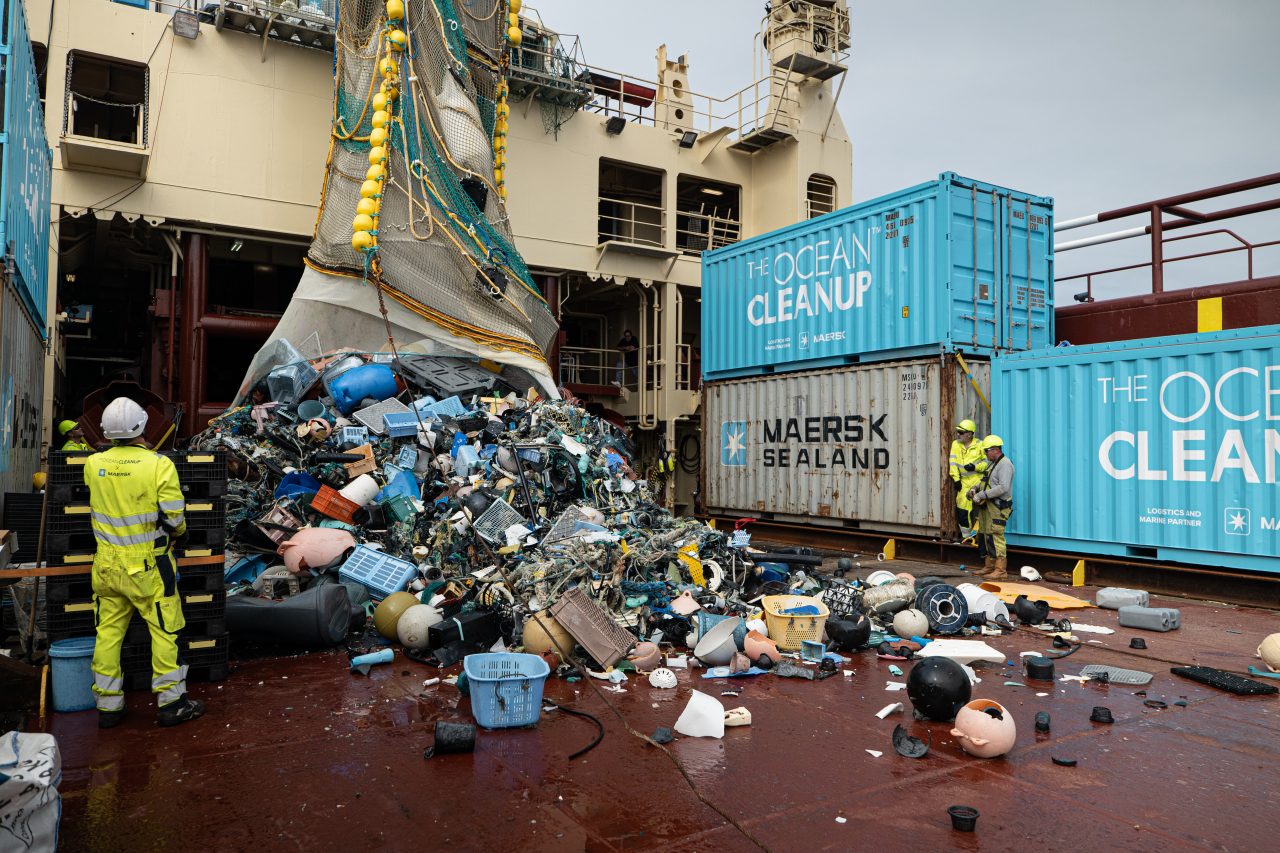
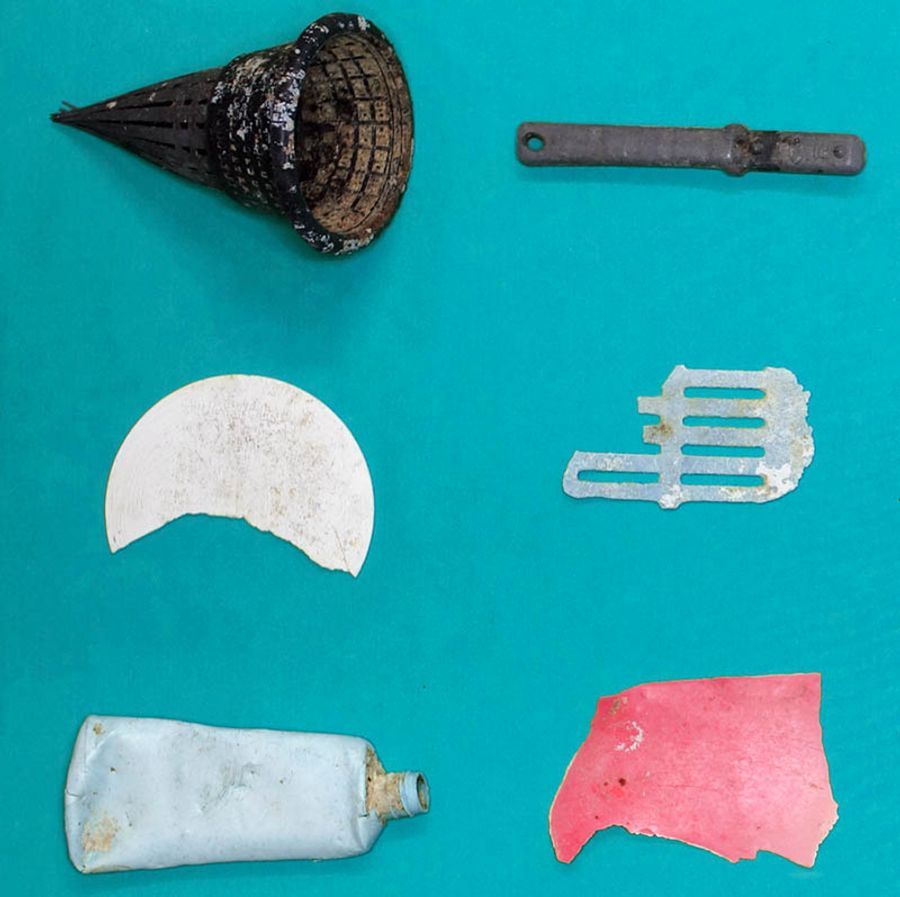
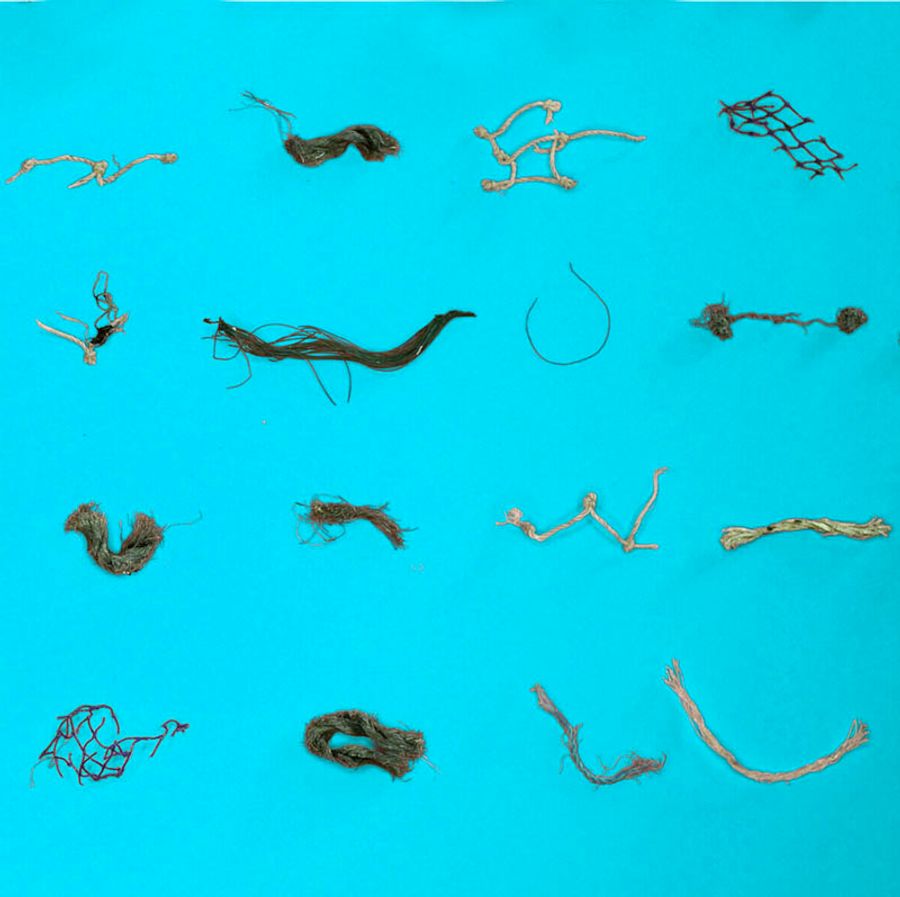
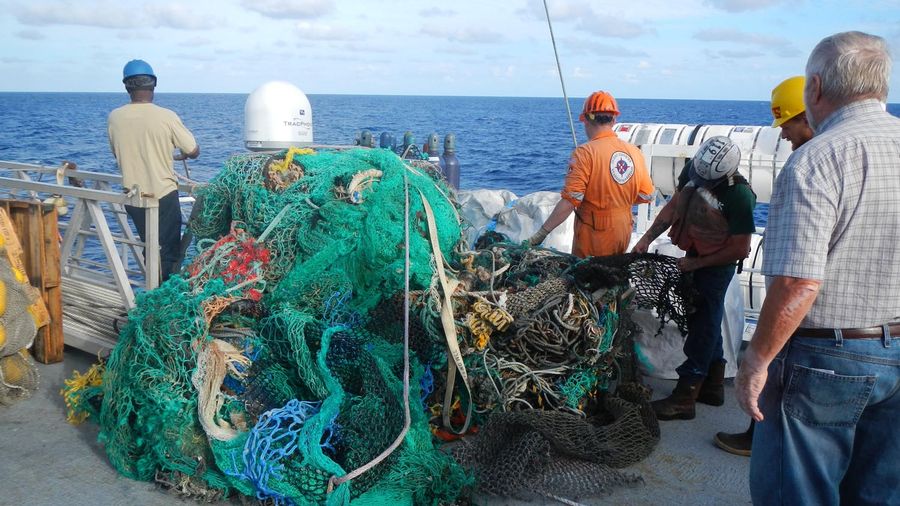
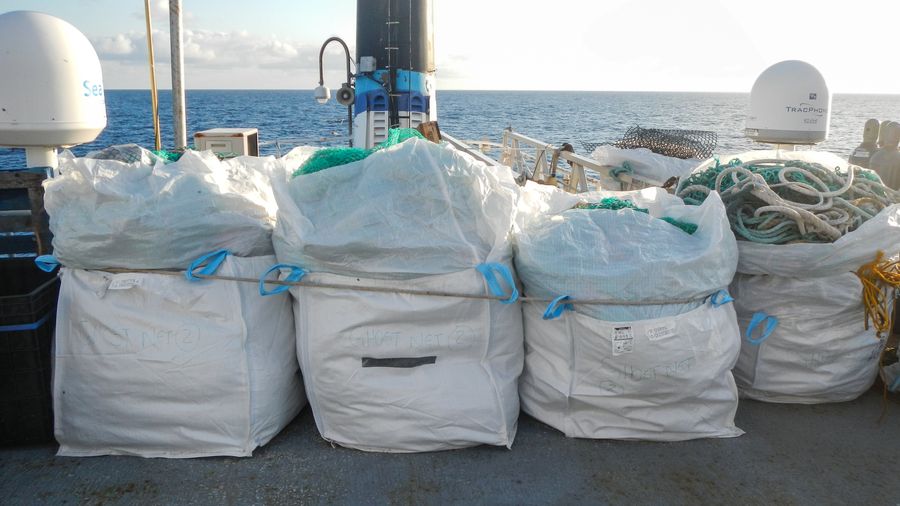
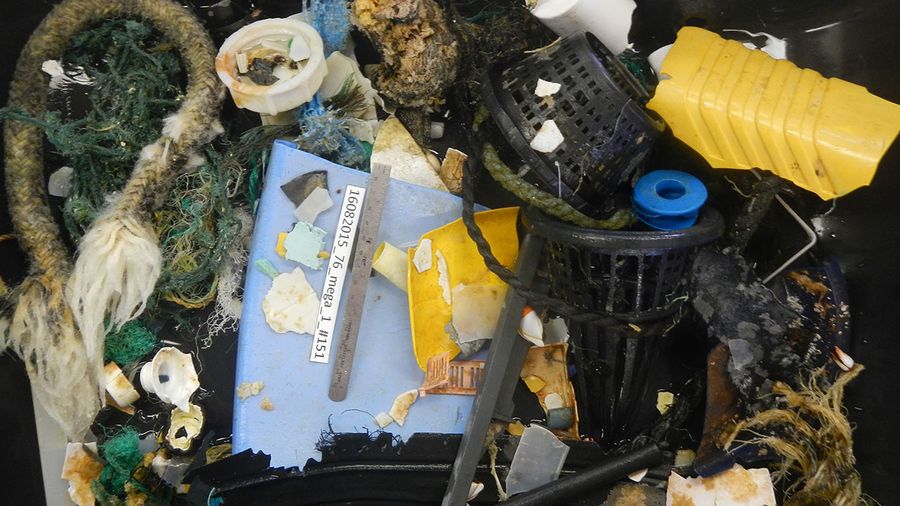
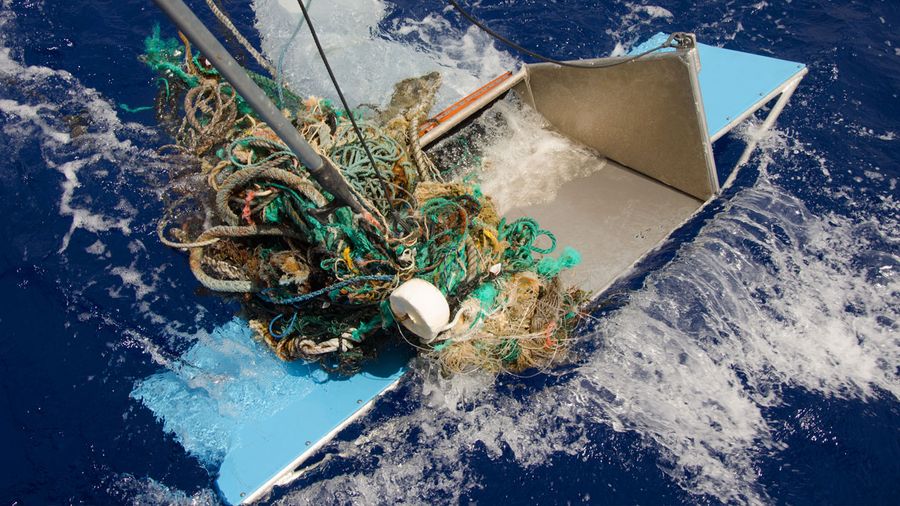
The vast majority of plastics retrieved were made of rigid or hard polyethylene (PE) or polypropylene (PP), or derelict fishing gear (nets and ropes particularly). Ranging in size from small fragments to larger objects and meter-sized fishing nets.
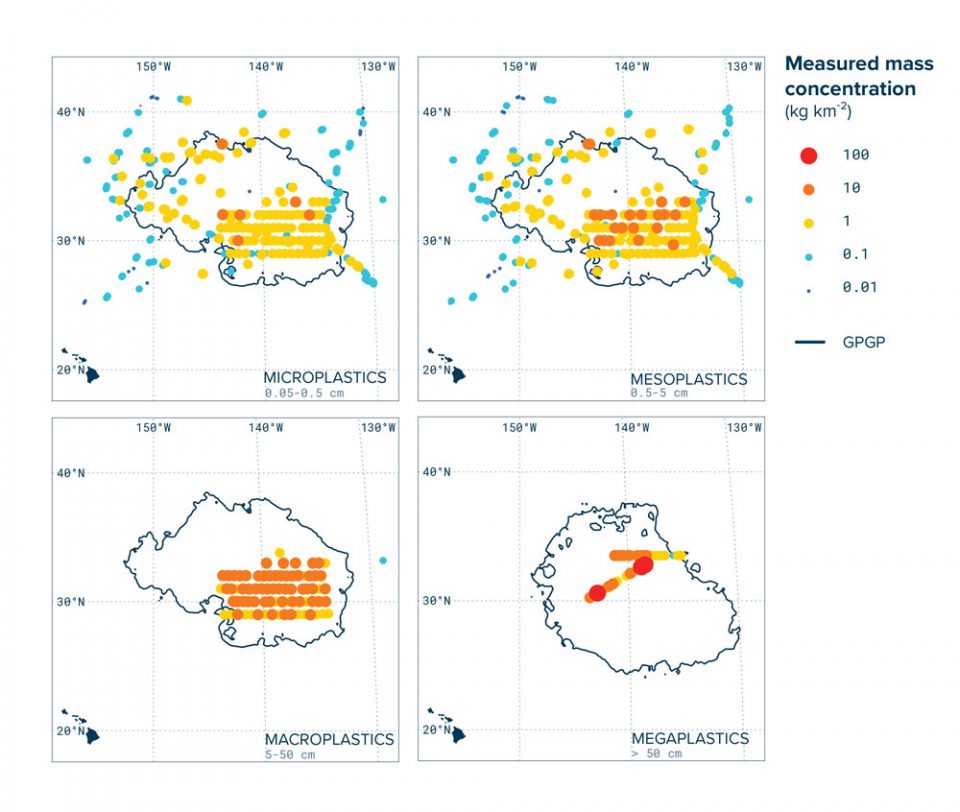
Size classes
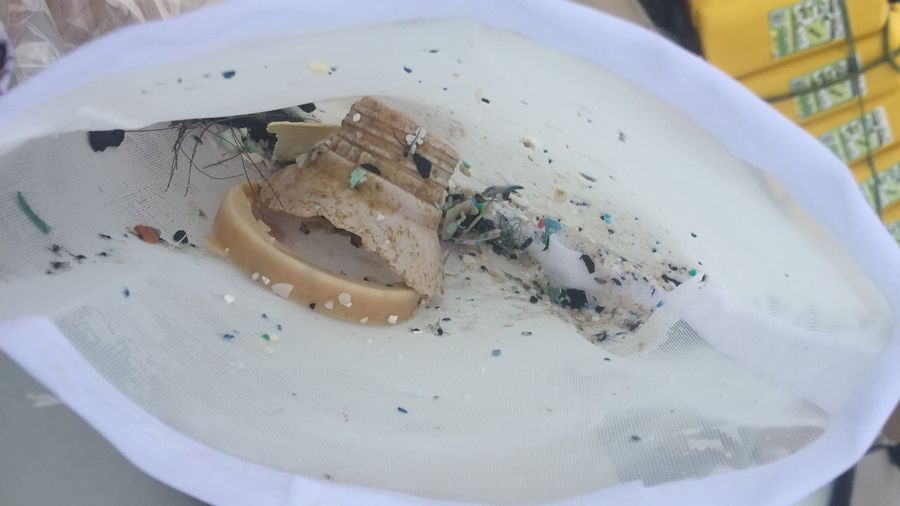
Plastic within the patch was categorized into four size classes:
– Microplastics (0.05 – 0.5 cm)
– Mesoplastics (0.5 – 5 cm)
– Macroplastics (5 – 50 cm)
– Megaplastics (anything above 50 cm)
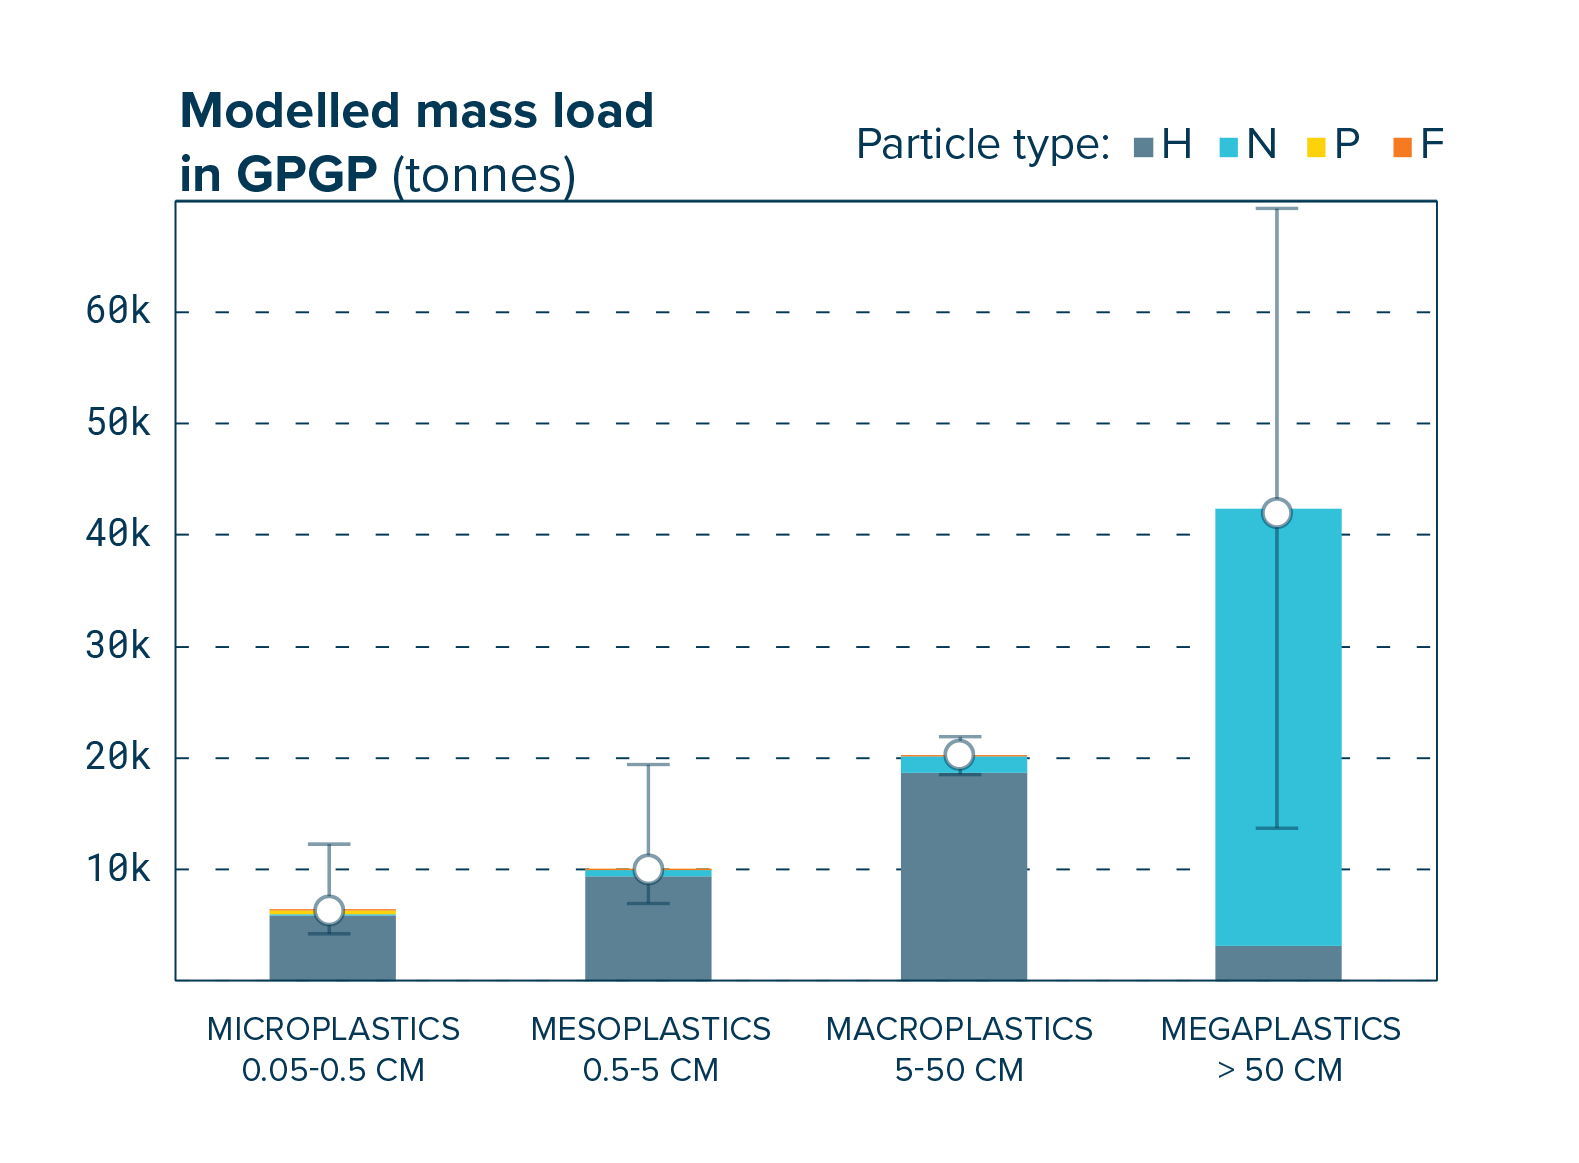
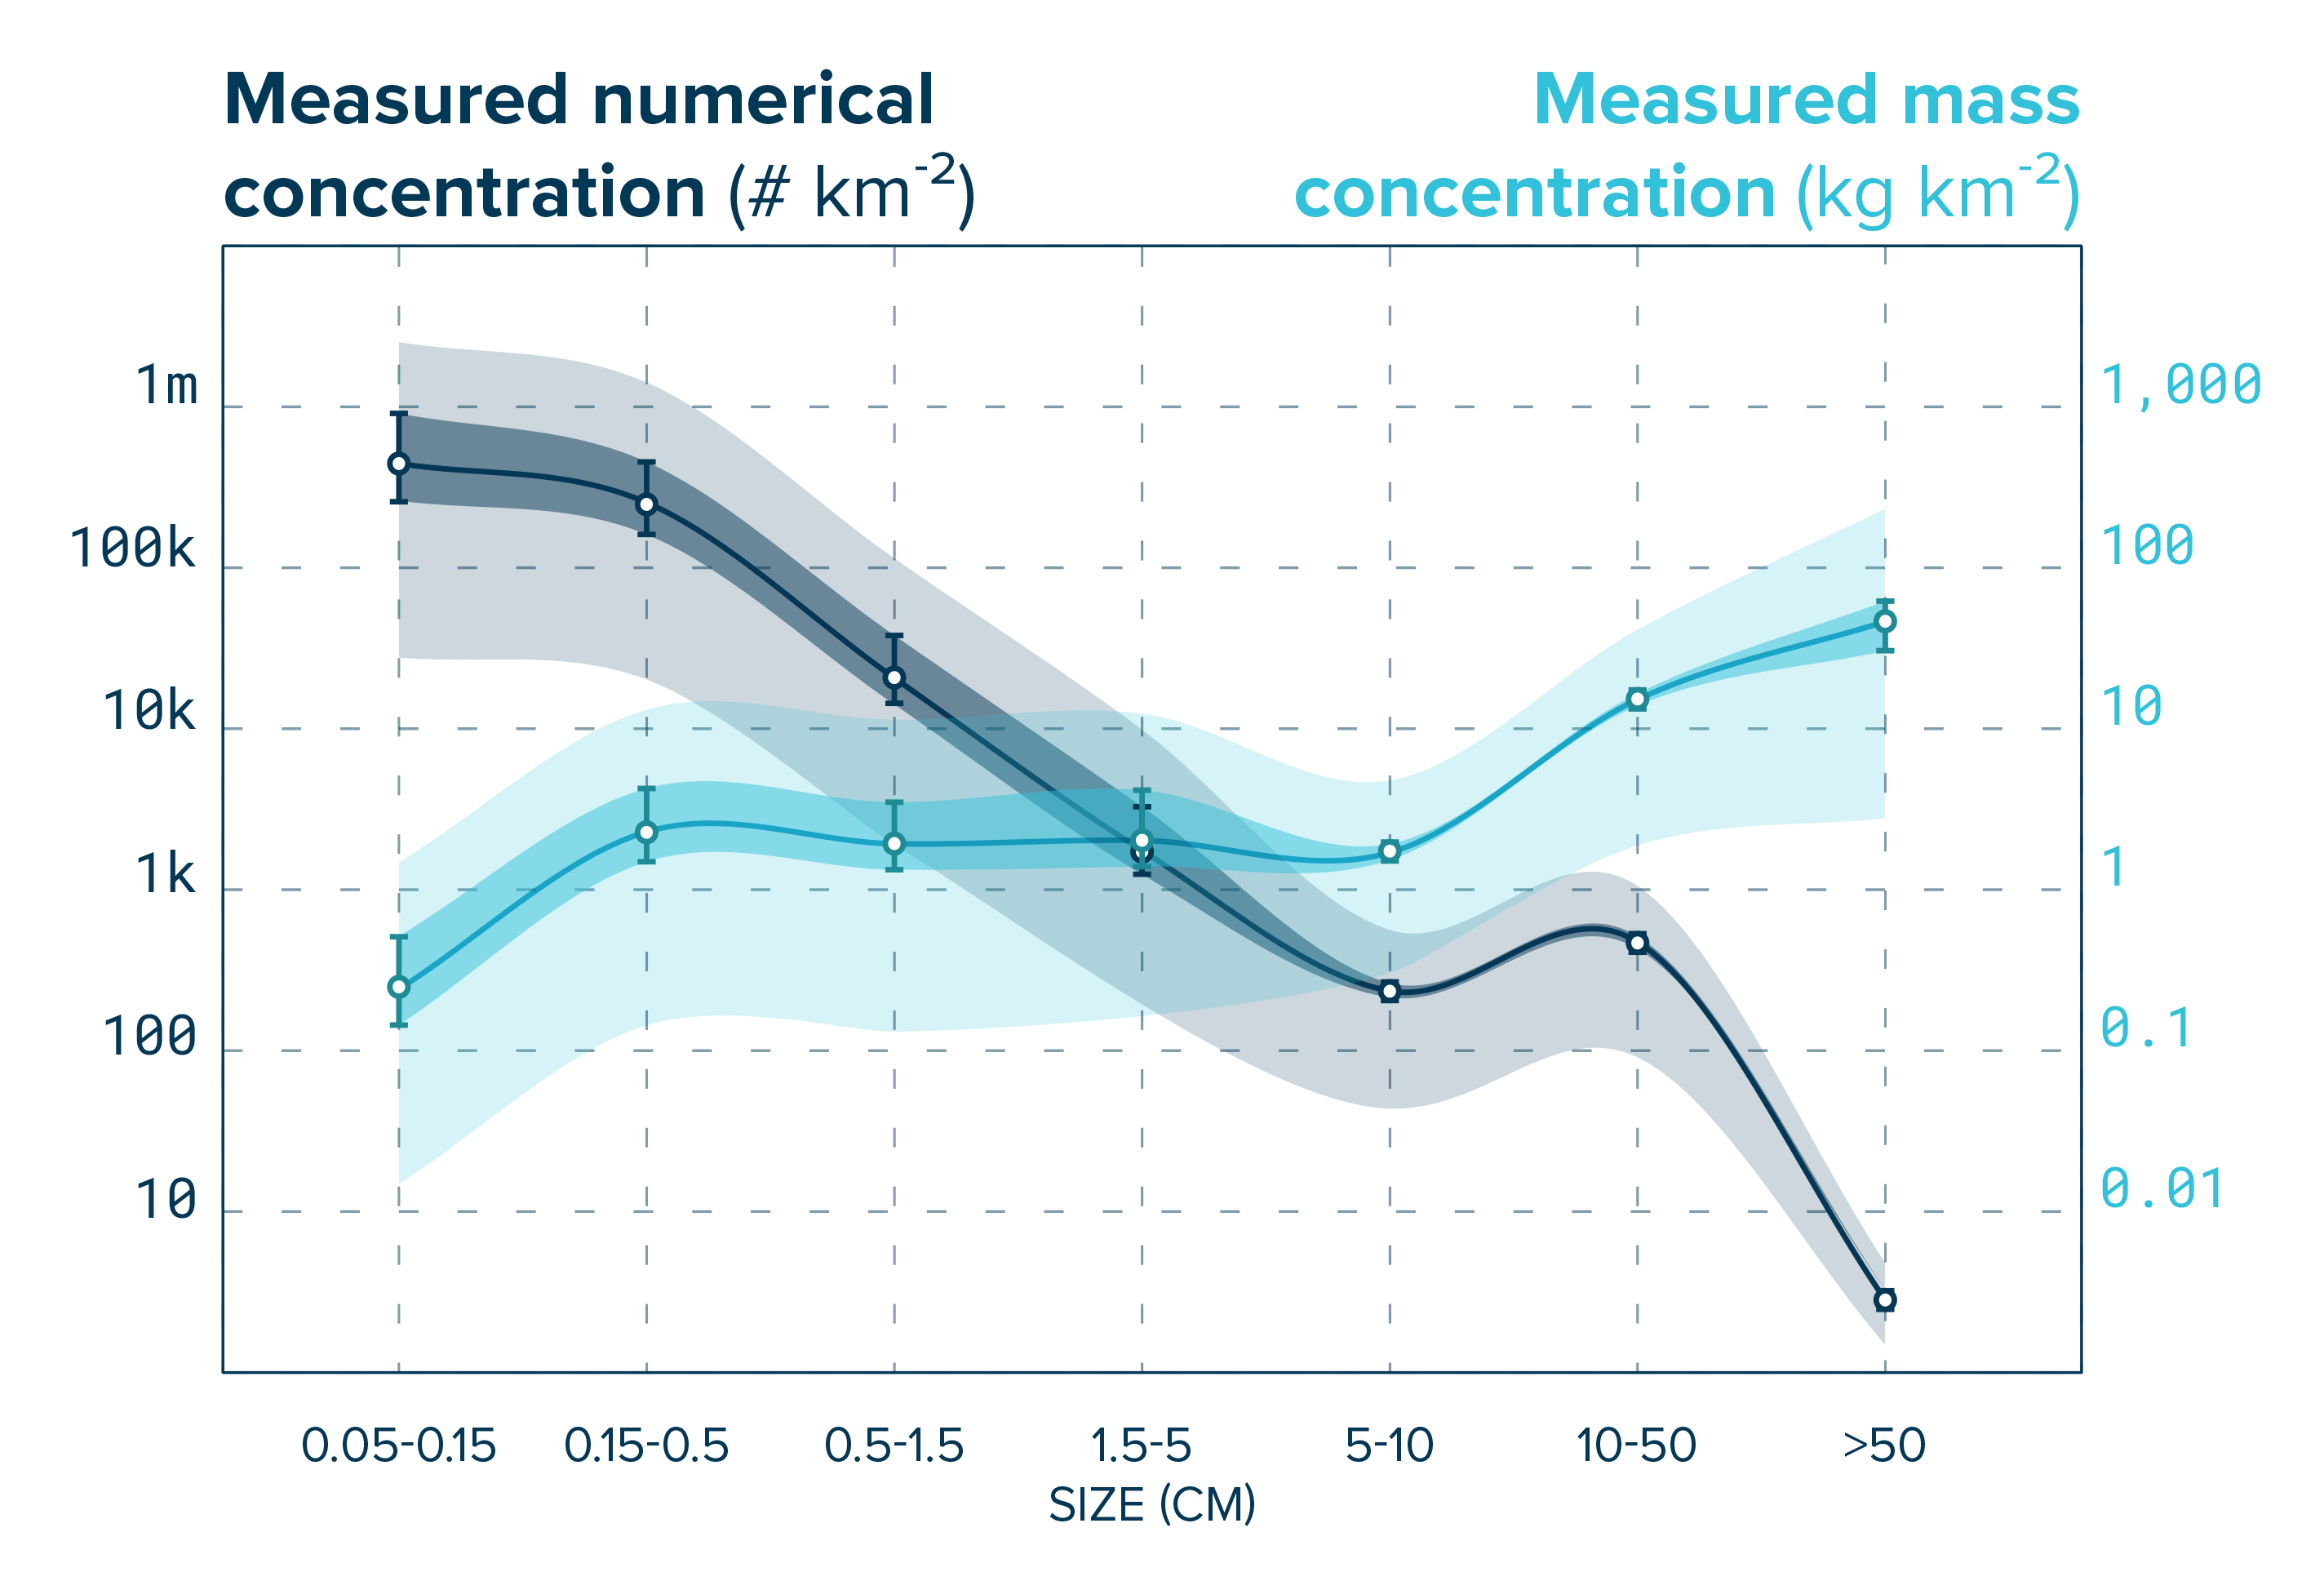
When accounting for the total mass, 92% of the debris found in the patch consists of objects larger than 0.5 cm, and three-quarters of the total mass is made of macro- and mega plastic. However, in terms of object count, 94% of the total is represented by microplastics.
Categorization types
Once the plastics were collected, a team of volunteers classified the plastic into:
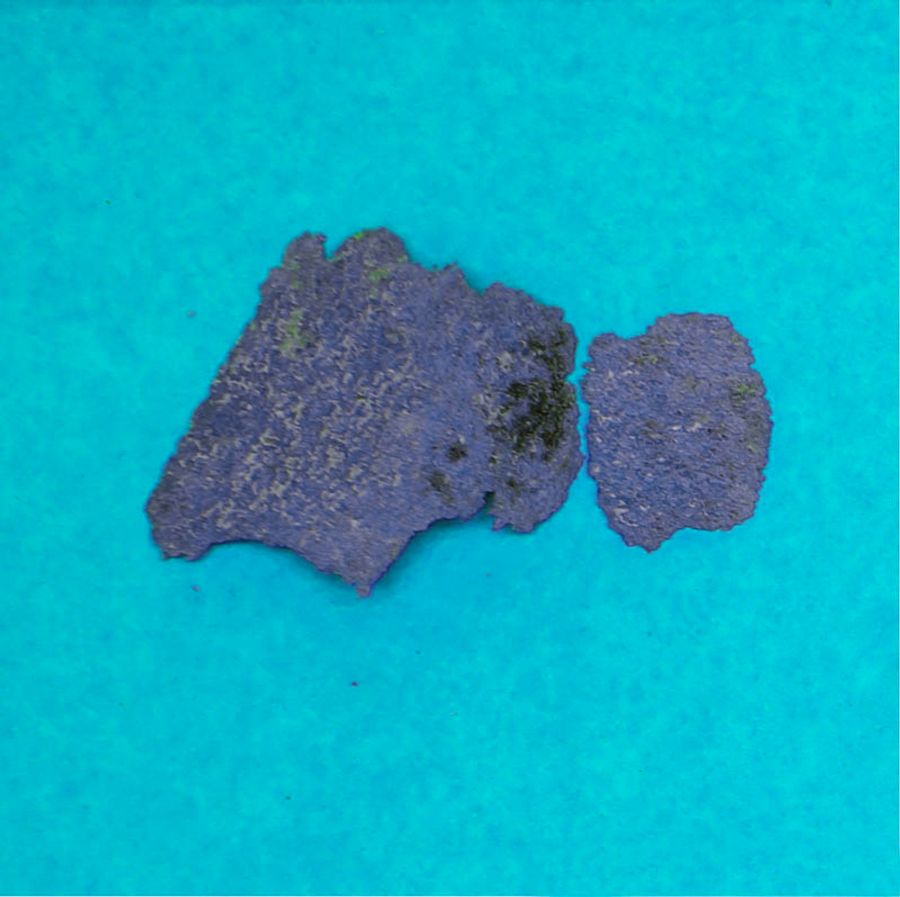
– Type H: Hard plastic, plastic sheet or film;
– Type N: Plastic lines, ropes, and fishing nets;
– Type P: Pre-production plastics (cylinders, spheres or disks);
– Type F: Fragments made of foamed materials
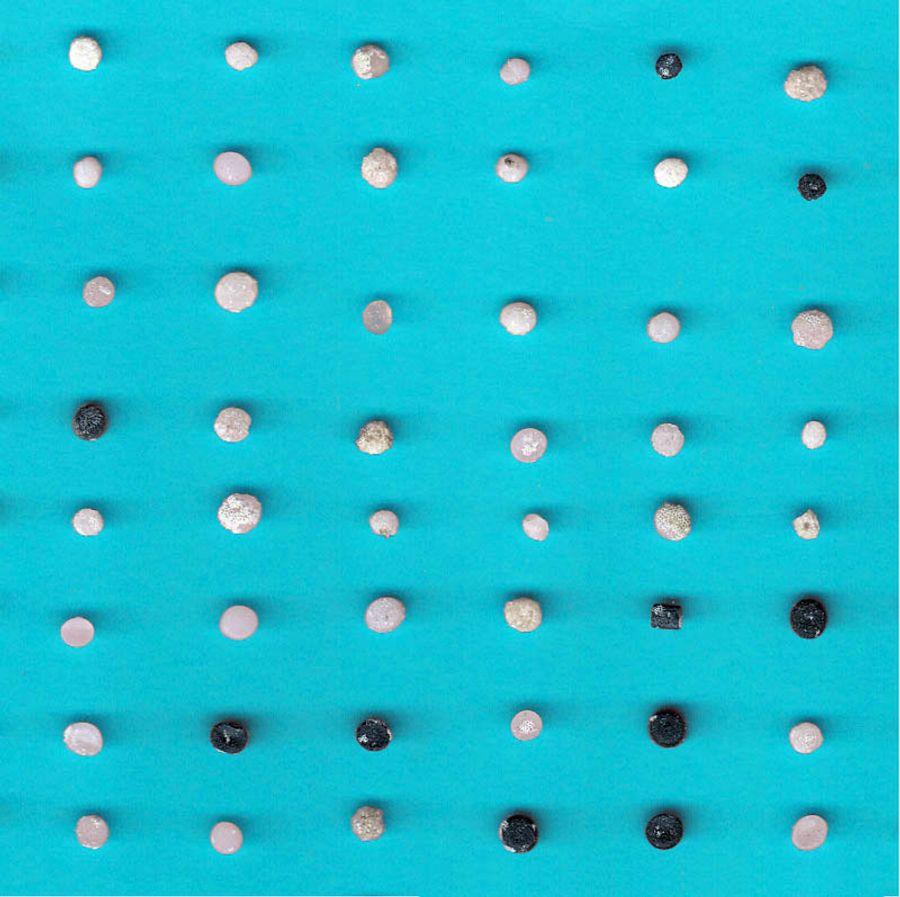
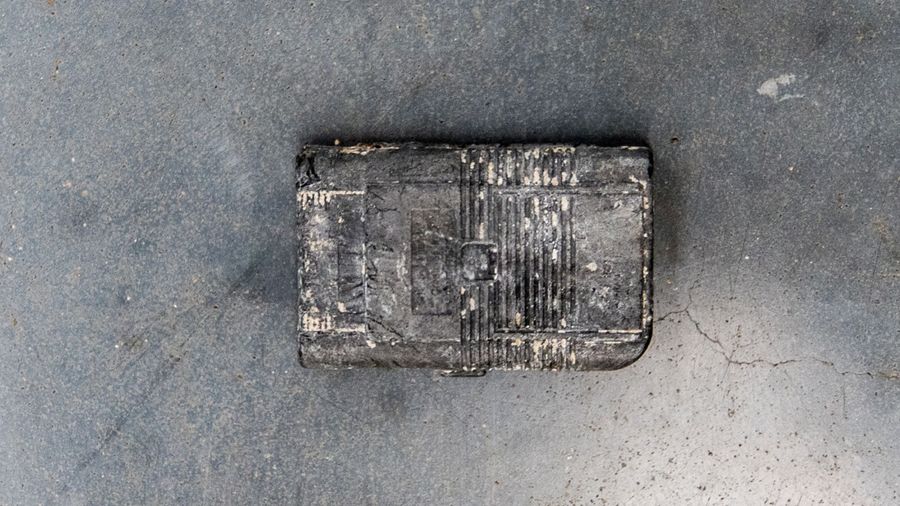
These plastic types were then screened for clues on age and origin. This was performed by examining each object for dates, languages, trademarks, symbols or ‘made in’ statements.
Why large debris matter
Because the plastics have been shown to persist in this region, they will likely break down into smaller plastics while floating in the GPGP.
This deterioration into microplastics is usually the result of sun exposure, waves, marine life, and temperature changes. Microplastics have been discovered floating within the water surface layers, but also in the water column or as far down as the ocean floor.
Once they become this small, microplastics are very difficult to remove and are often mistaken for food by marine animals.
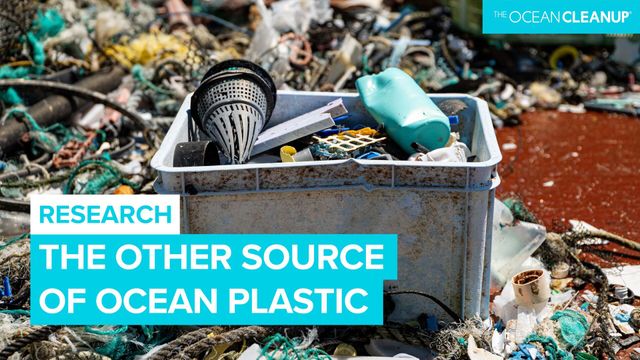
WHERE DOES THE PLASTIC COME FROM?
While plastic emissions from rivers remain the main source of plastic pollution from a global ocean perspective; our study conducted in 2022 reveals 75% to 86% of plastic debris in the Great Pacific Garbage Patch (GPGP) originates from fishing activities at sea. Particles accumulating in the GPGP were predominantly identified as originating from Japan, China, the Korean peninsula and the USA.
The finding confirms that stopping plastic inflow from land and river will not be enough to stop the GPGP to grow – we need to work with policy makers to find a binding agreement on the use of plastic in the industry.
What are the effects on marine life, humans and ecosystems?
Not only does plastic pollution in the Great Pacific Garbage Patch pose risks for the safety and health of marine animals, but there are health and economic implications for humans as well.
Impact on wildlife
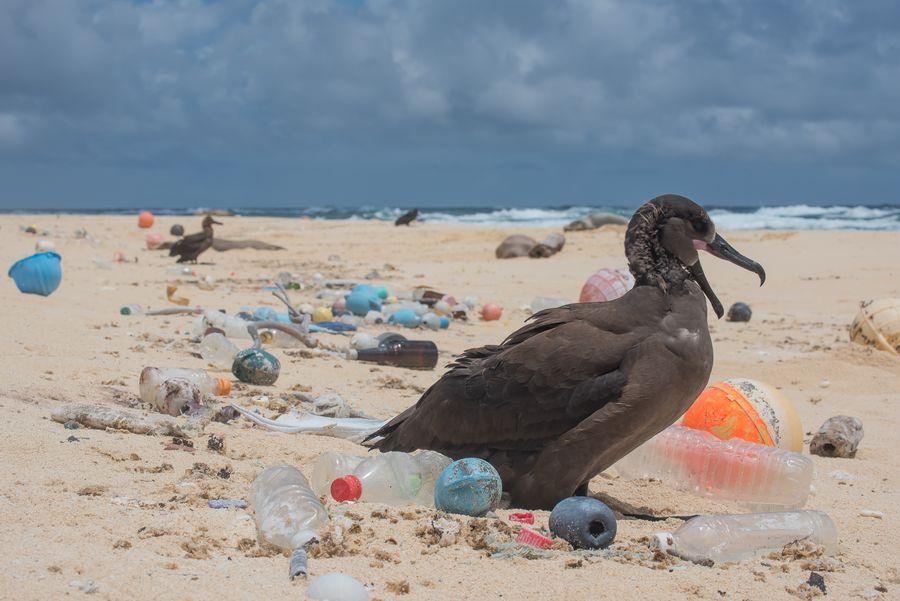
Plastic has increasingly become a ubiquitous substance in the ocean. Due to its size and color, animals confuse the plastic for food, causing malnutrition; it poses entanglement risks and threatens their overall behavior, health, and existence.
Studies have shown that about 900 species have encountered marine debris, and 92% of these interactions are with plastic. 17% of the species affected by plastic are on the IUCN (International Union for Conservation of Nature) Red List of Threatened Species.
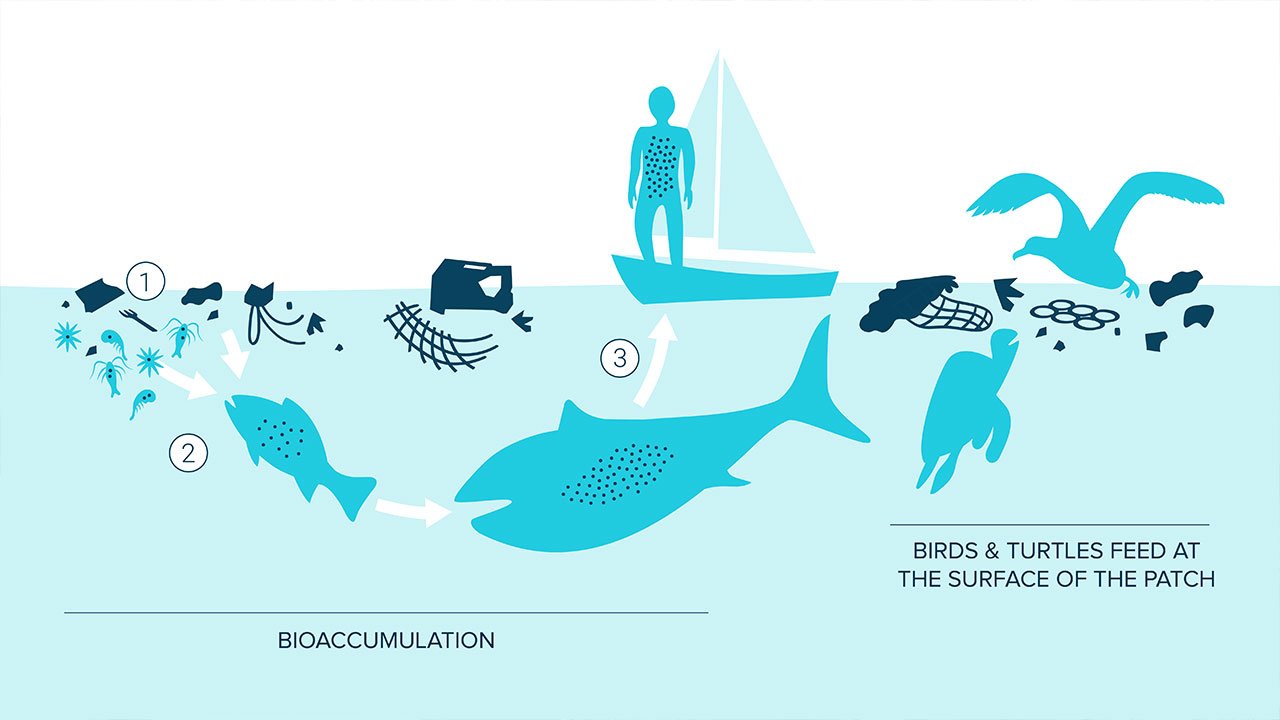
Toxic for Sea Surface Feeders
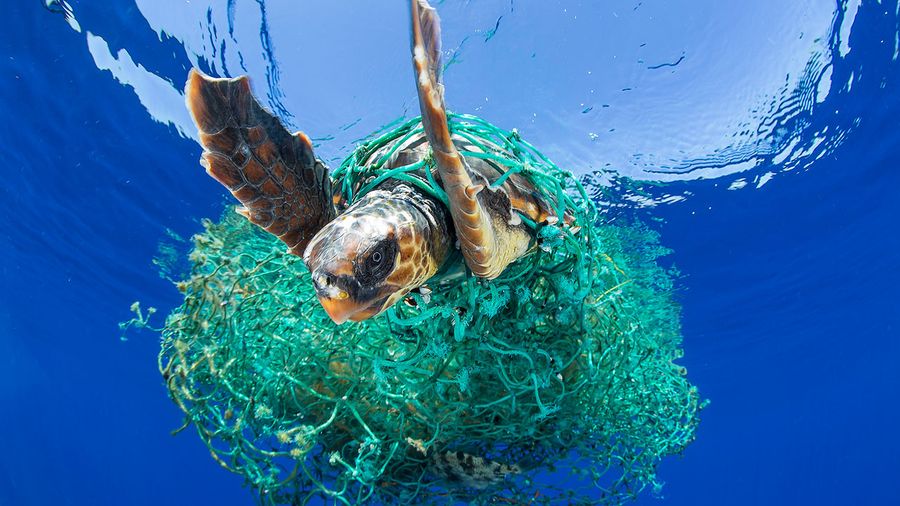
Floating at the surface of the Great Pacific Garbage Patch (GPGP) is 180x more plastic than marine life. Animals migrating through or inhabiting this area are then likely consuming plastic in the patch. For example, sea turtles by-caught in fisheries operating within and around the patch can have up to 74% (by dry weight) of their diets composed of ocean plastics. Laysan albatross chicks from Kure Atoll and Oahu Island have around 45% of their wet mass composed of plastics from surface waters of the GPGP.
Since 84% of this plastic was found to have at least one Persistent Bio-accumulative Toxic Persistent Bio-accumulative Toxic (PBT) chemical, animals consuming this debris are therefore ingesting the chemicals attached to the plastic.
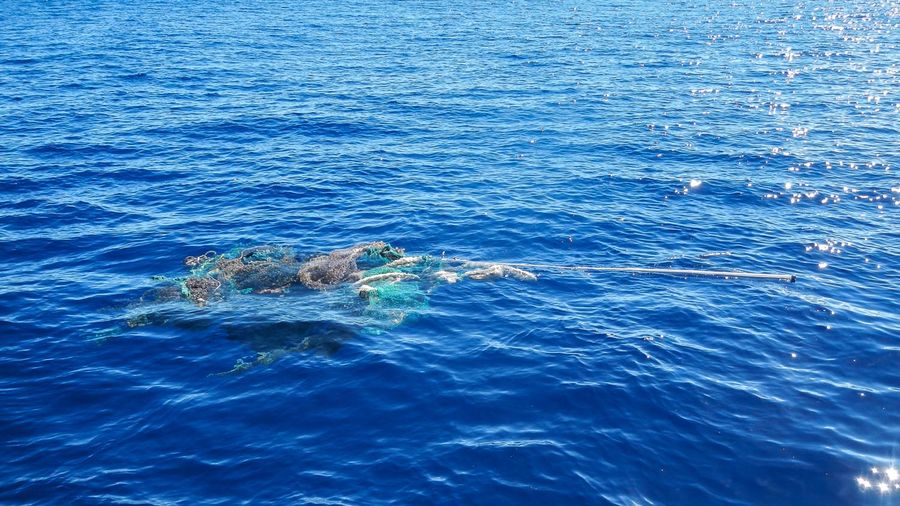
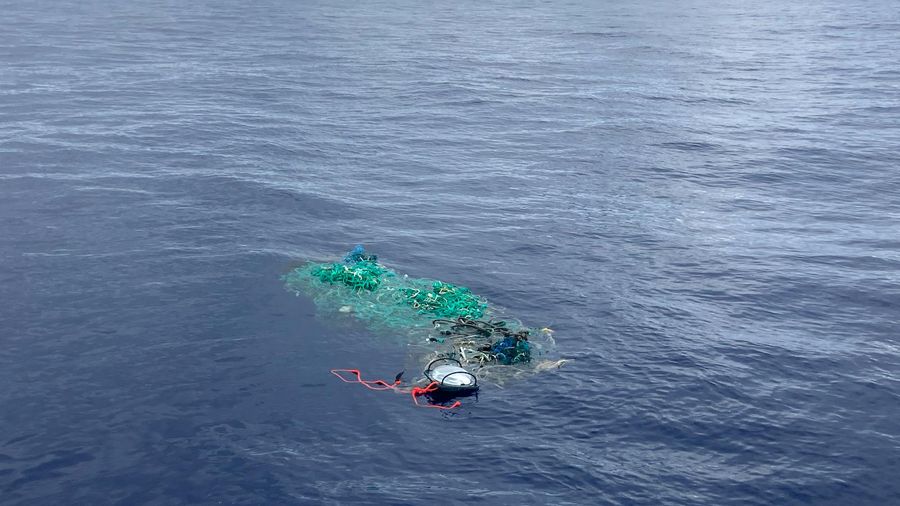
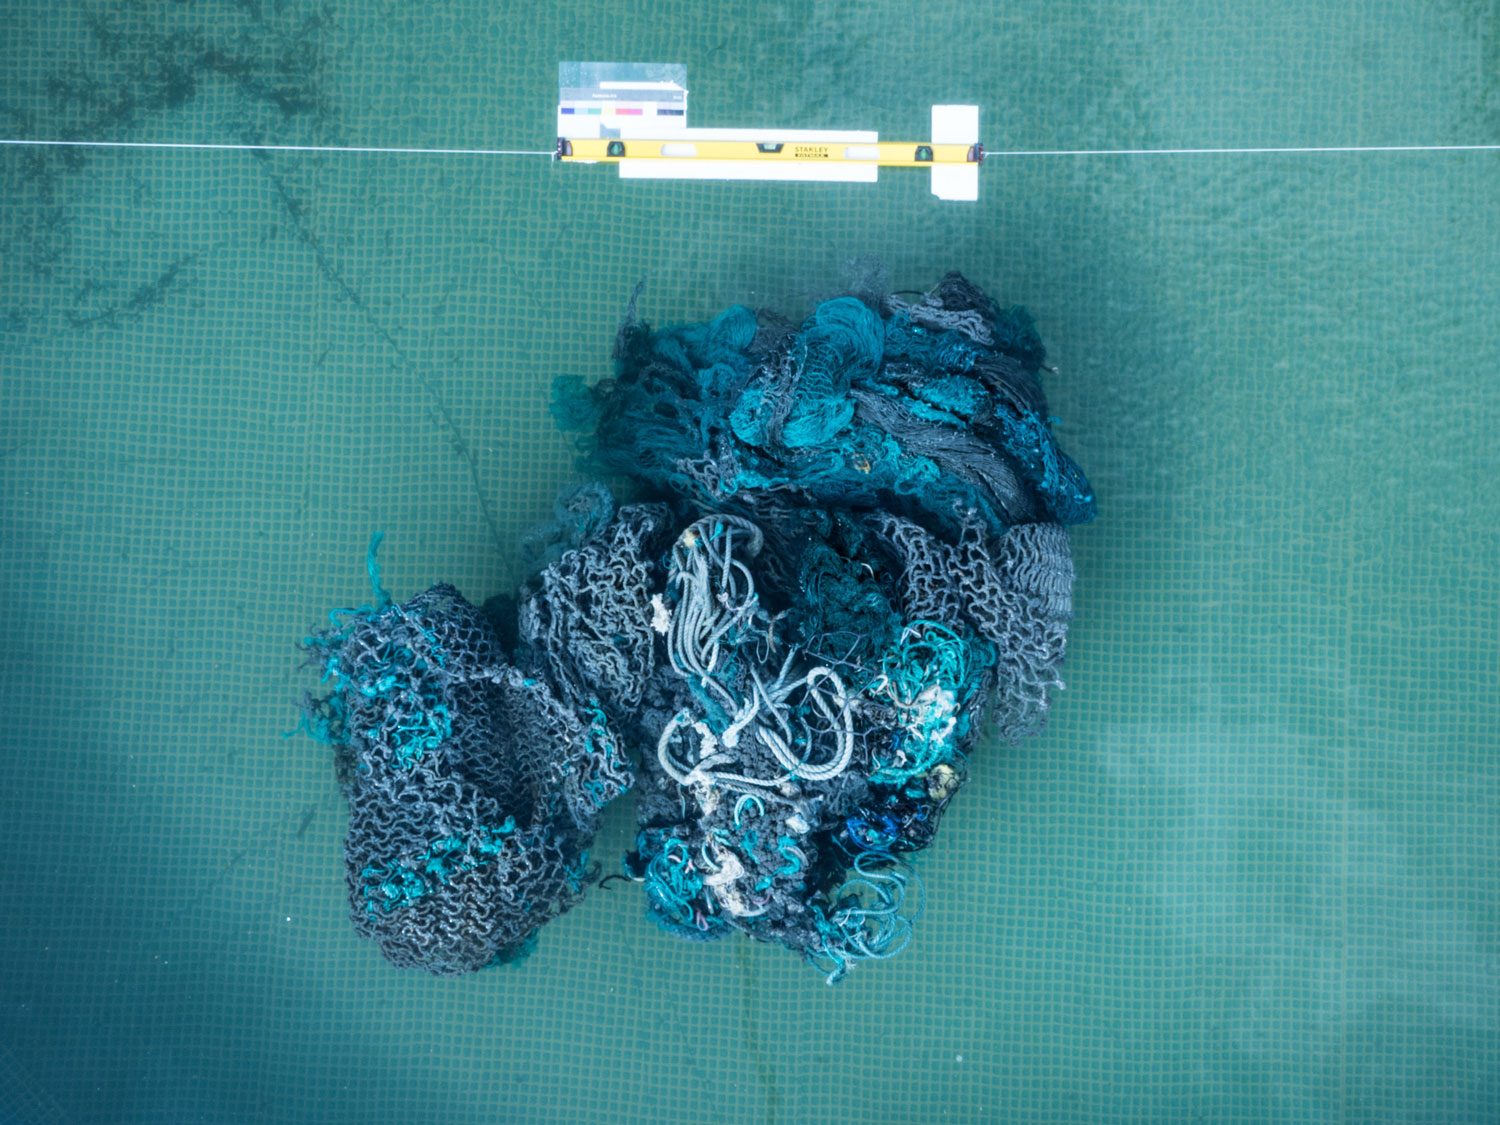
Entanglement of Marine Life
Fishing nets account for 46% of the mass in the GPGP and they can be dangerous for animals who swim or collide into them and cannot extract themselves from the net. Interaction with these discarded nets, also known as ghost nets , often results in the death of the marine life involved.
Impact on Humans and Society
Once plastic enters the marine food web, there is a possibility that it will contaminate the human food chain as well. Efforts to clean and eradicate ocean plastic have also caused significant financial burdens.
Affects the Human Foodchain
Through a process called bioaccumulation, chemicals in plastics will enter the body of the animal feeding on the plastic, and as the feeder becomes prey, the chemicals will pass to the predator – making their way up the food web that includes humans. These chemicals that affected the plastic feeders could then be present within the human as well.
Affects the Economy
It is estimated that marine ecosystems provide benefits of up to $50 trillion per year through their ecosystem services (Constanza et al., 2014). Plastic pollution is estimated to reduce the value of these ecosystem services by $500 to $2500 billion per year (Beaumont et al., 2019).
This means that intercepting plastic in rivers is much more cost-effective than dealing with the consequences downstream. Learn more in our interactive map.

IMPACT ON ECOSYSTEMS
At The Ocean Cleanup, we have been working to optimize our operations in the Great Pacific Garbage Patch in order to increase efficiency and reduce our environmental impact.
The Environment and Social Affairs team focuses on research into the impact of our operations. One area of investigation centered upon using scientific analysis to assess whether our mission is worth completing.
Net Environment Benefit Assessment
A peer-reviewed study assessed the environmental impact of removing plastic from the Great Pacific Garbage Patch. The verdict: the benefits outweigh the costs.
The findings from this collaborative research between our in-house experts and independent scientists highlighted that the benefits of cleaning the GPGP outweighed potential environmental costs, including greenhouse gas emissions and ecosystem disruptions from carrying out the cleanup .
The study states that the findings show that marine life is more vulnerable to plastic pollution than to our offshore cleanup efforts in the GPGP.
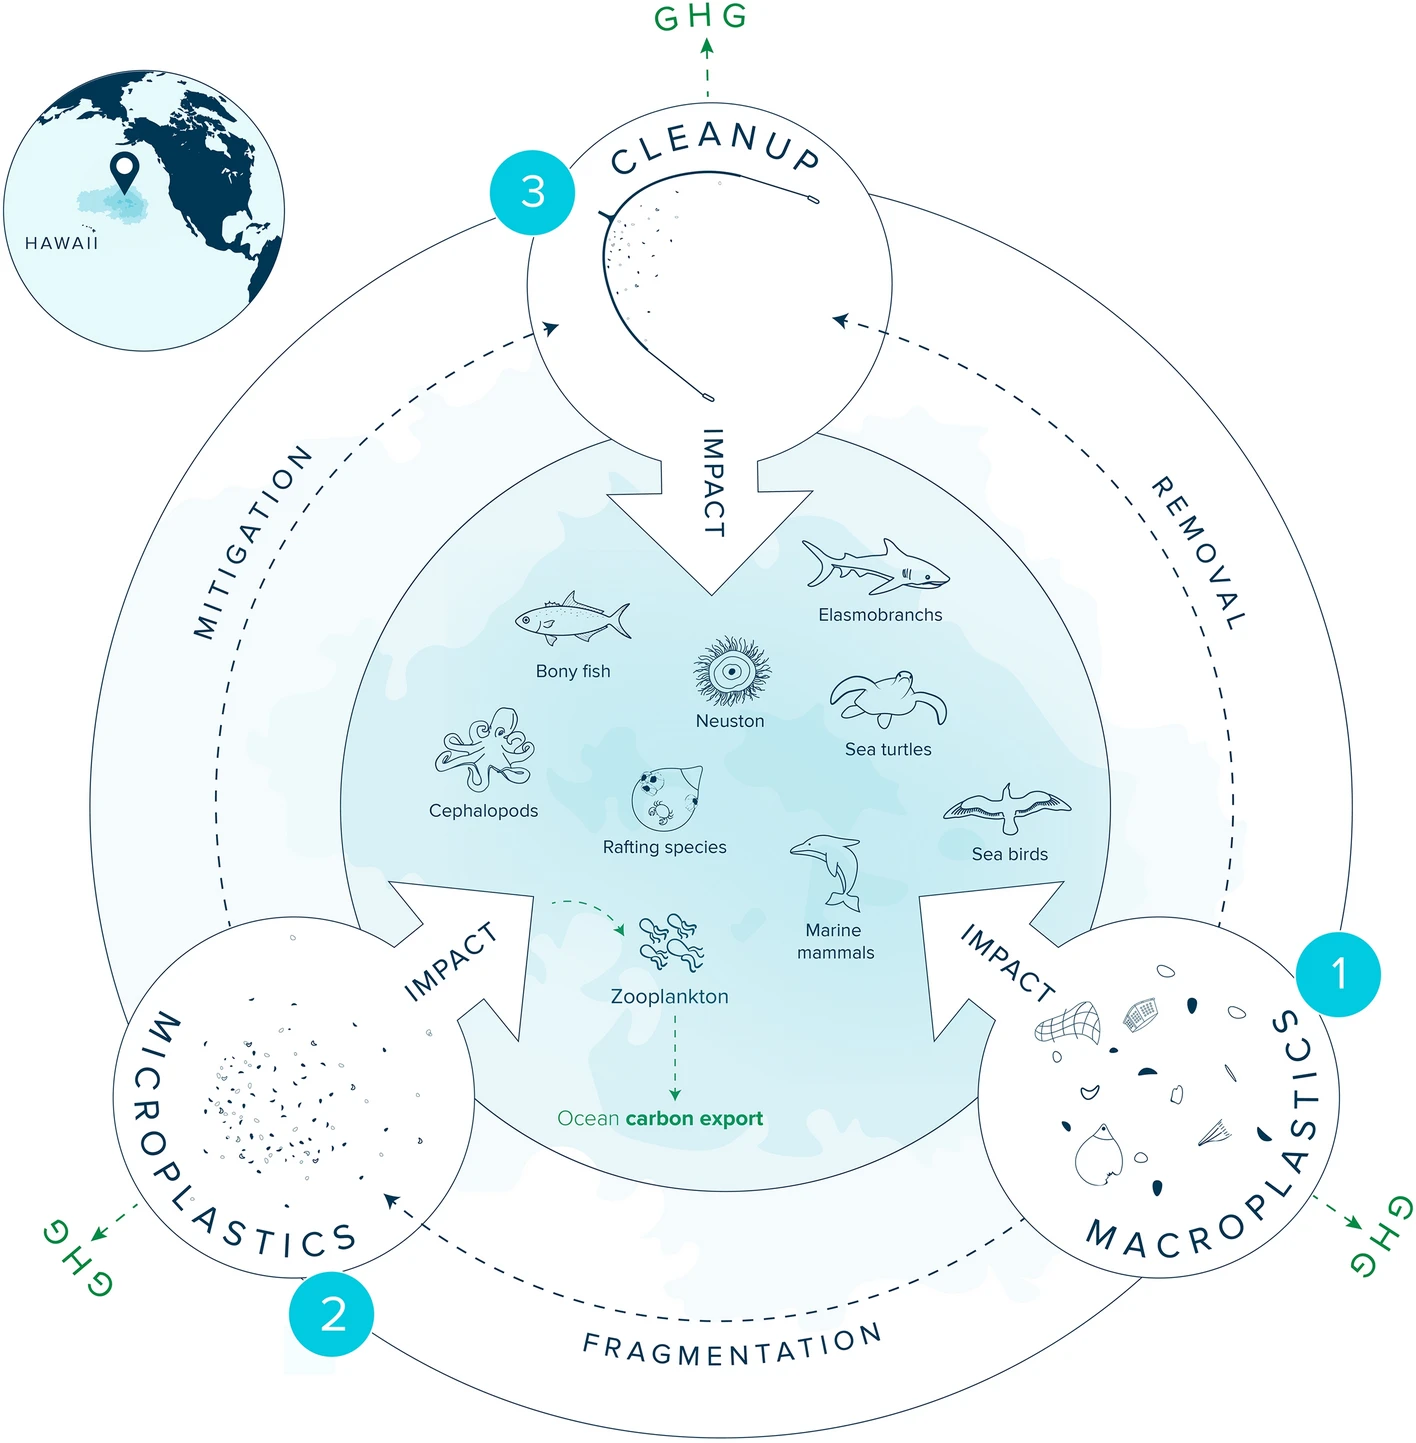
The carbon emissions from the vessels used to tow the system that sweeps the four-meter-deep top layer of the ocean surface to concentrate the floating debris were found to be significantly lower than mitigated potential long-term microplastics impacts on ocean carbon sequestration. Moreover, improving cleanup efficiency and using AI to target plastic hotspots will further cut emissions.
How did The Ocean Cleanup conduct its research?
Resulting from several research missions, traveling across and above the GPGP, The Ocean Cleanup team compiled an unprecedented amount of data to better understand the plastic that persists in this region.
Research Expeditions
Scientists have been studying this area since the 1970’s – usually by means of dragging a small sampling net through the debris. This method showed a bias towards smaller objects and did not provide much insight into the larger pieces, and, thus, the entire scope of the GPGP.
Over the course of three years, researchers at The Ocean Cleanup went on several data collection missions. This included the Multi-Level-Trawl expedition, where they analyzed the depth at which buoyant plastic debris may be vertically distributed; the Mega Expedition using vessels to cross the patch with many trawls at once; and the Aerial Expedition which involved the use of a plane flying at low altitude to observe the debris from above.
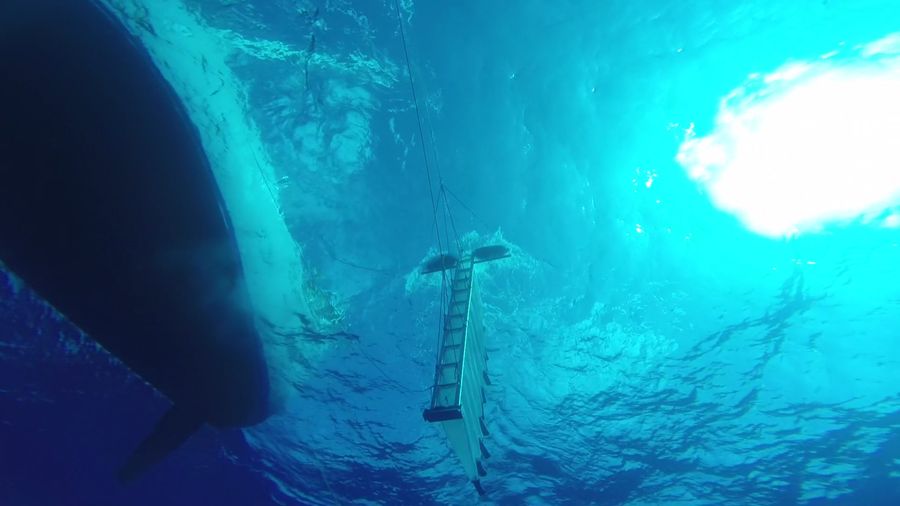
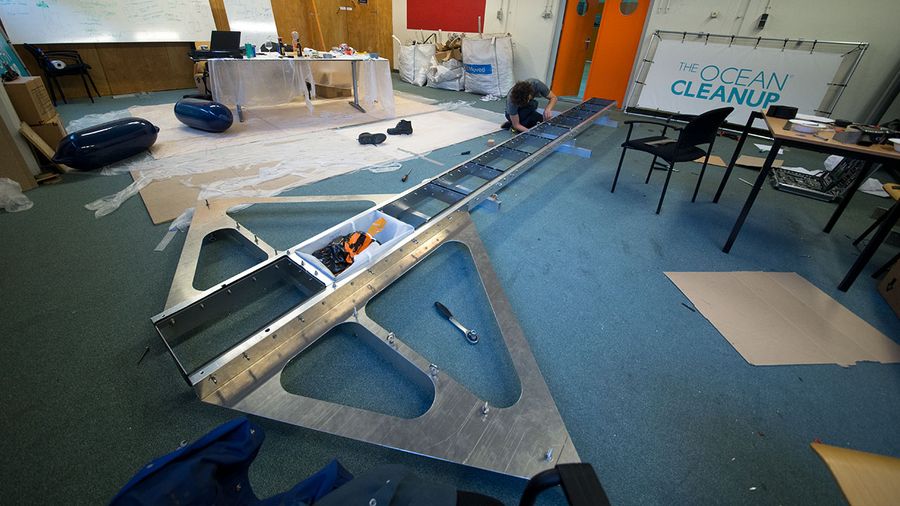
2015 – Multi-Level-Trawl Expedition
Realizing that previous methods of analyzing the plastic in the patch needed improvement, The Ocean Cleanup designed a new research tool, called the multi-level-trawl, which allowed measurements of 11 water layers simultaneously going as far down as 5 meters below surface level. This trawl was then used in the Vertical Distribution Research.
The multi-level-trawl allowed the team to study further down into the water and understand to which depths buoyant plastic may be distributed. Through these studies, it was observed that buoyant plastic floats primarily in the first few meters of the water.
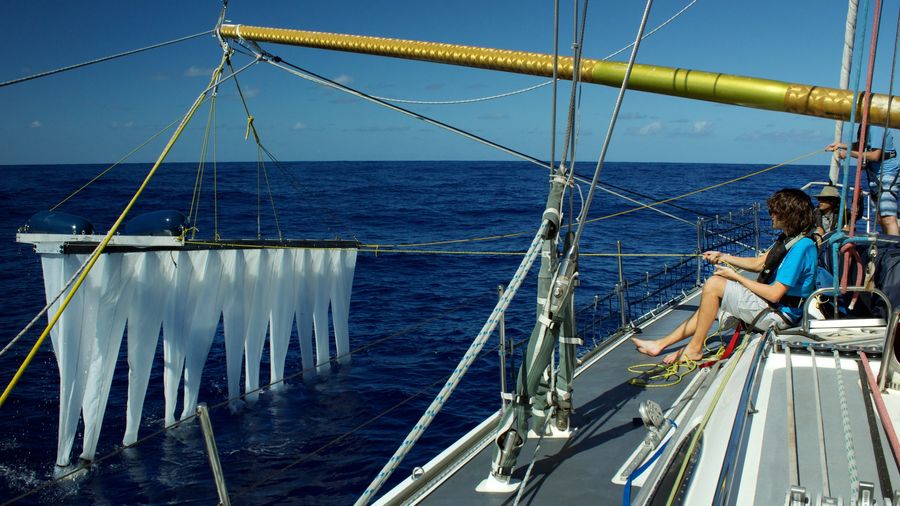
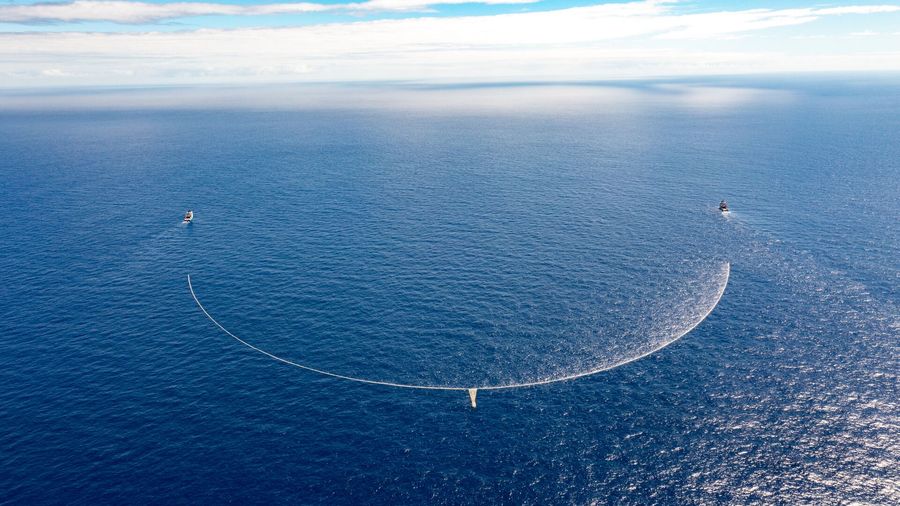
2015 – Mega Expedition
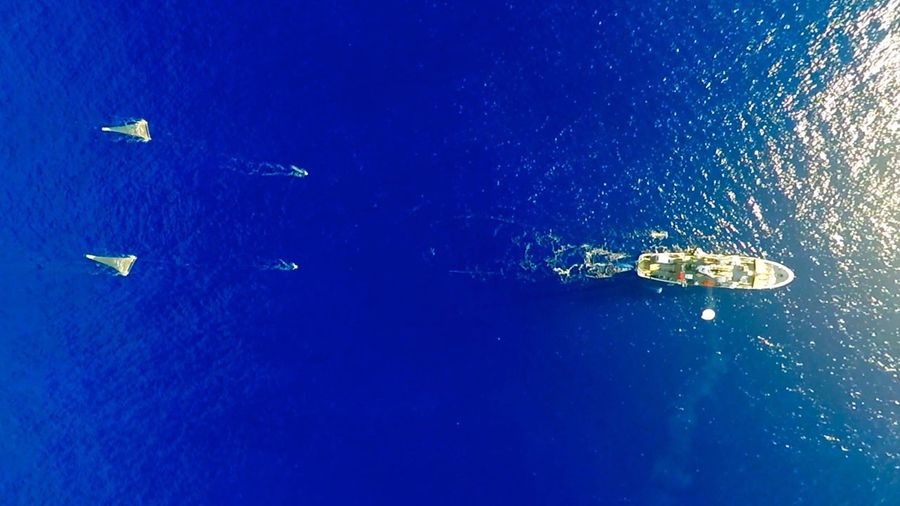
In 2015, 30 vessels and 652 surface nets, in parallel, crossed the GPGP as part of the Mega Expedition.
Numerous vessel owners offered the use of their ships for the mission. Of those ships, many carried behind them a Manta-trawl; including one mothership, the 171ft long Ocean Starr, which was able to carry two 6-meter-wide trawls and a survey balloon.
The fleet returned with over 1.2 million plastic samples that rendered an unprecedented amount of plastic measurements from the three months of study. Scientists present on the expedition noted that there was an alarming amount of plastic floating in the patch, and their preliminary findings indicated that there were more large objects than originally expected.
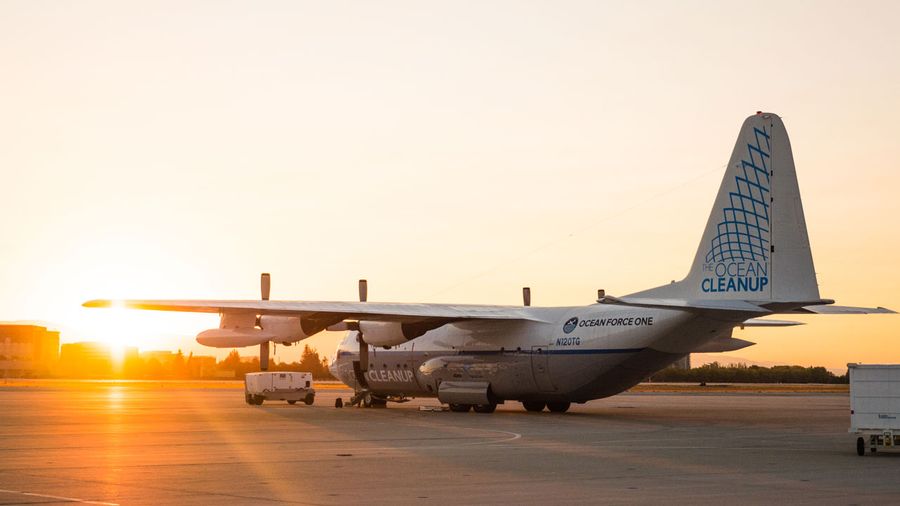
2016 – Aerial Expedition
After the Mega Expedition, the team wanted to learn more about these large plastic pieces that were difficult to come by. Megaplastics are more scattered than the smaller plastics, and, to study this important aspect of the patch, the team needed to cover an even larger area.
Using a C-130 Hercules aircraft, The Ocean Cleanup surveyed 311 km² with advanced sensors and an RGB camera (CS-4800i) that captured one photo every second of flight time. They took two flights and came back with over 7,000 single frame mosaics from the mission.
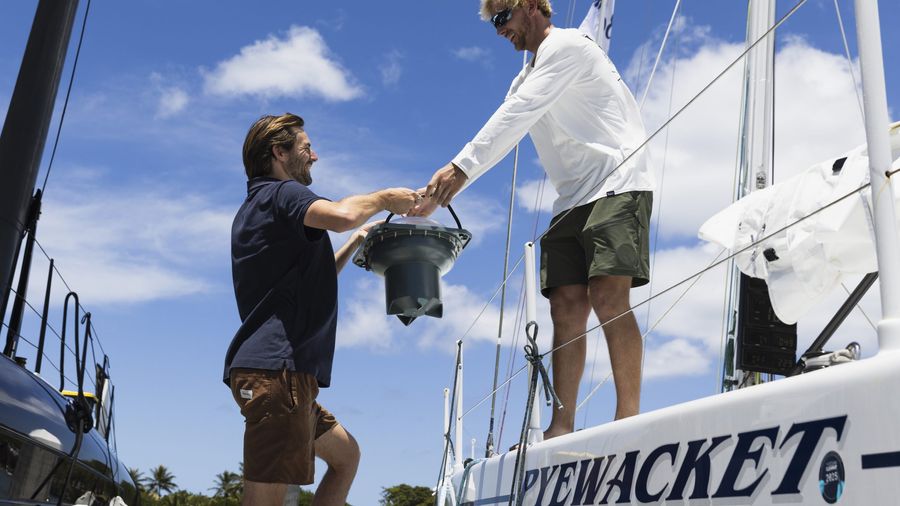
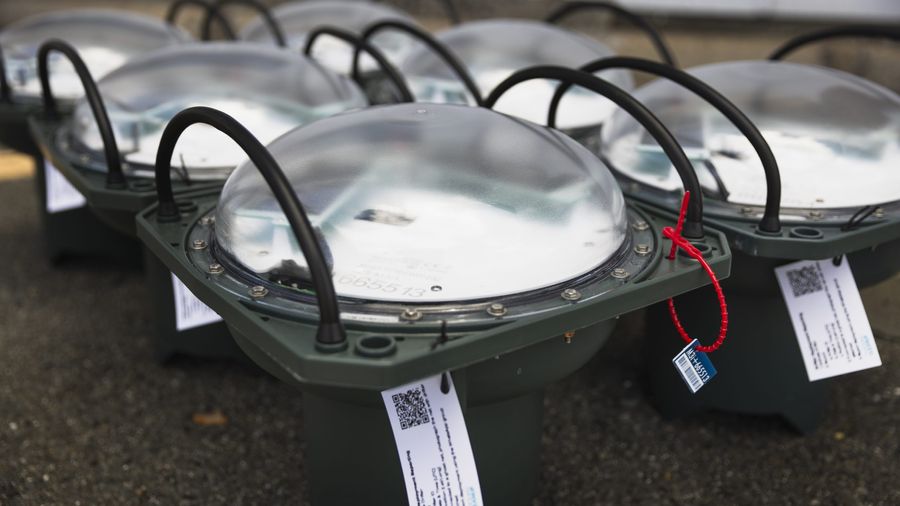
2025 – Pacific Data Expedition
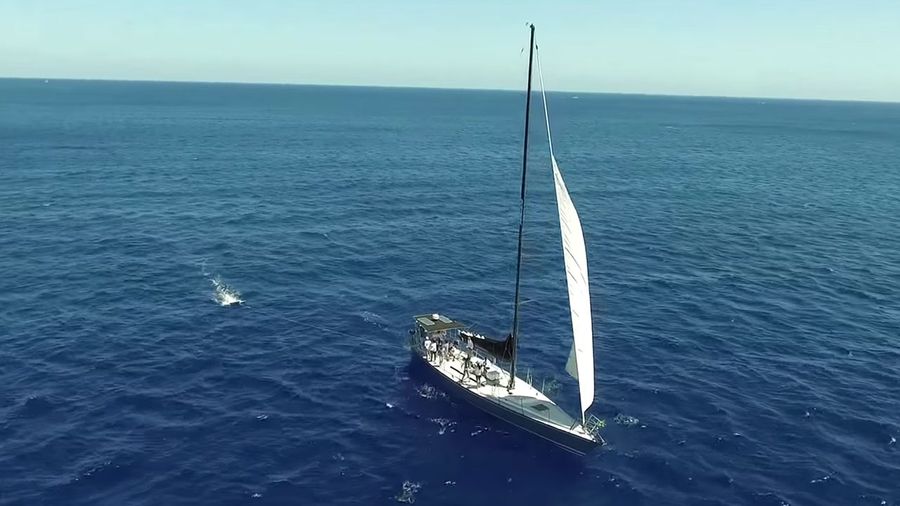
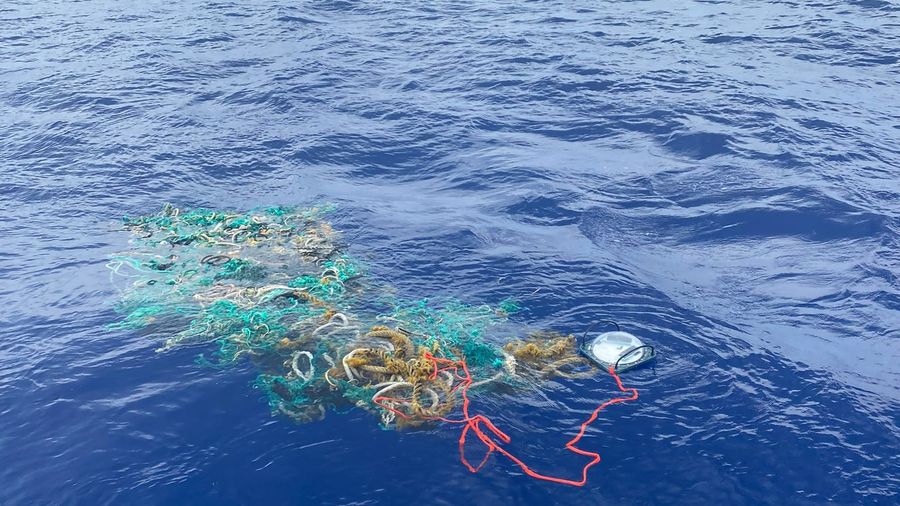
Fresh off the 2,225-nautical mile Transpacific Yacht Race, sailors in Hawaii joined The Ocean Cleanup’s Pacific Data Expedition 2025, helping map plastic in the Great Pacific Garbage Patch.
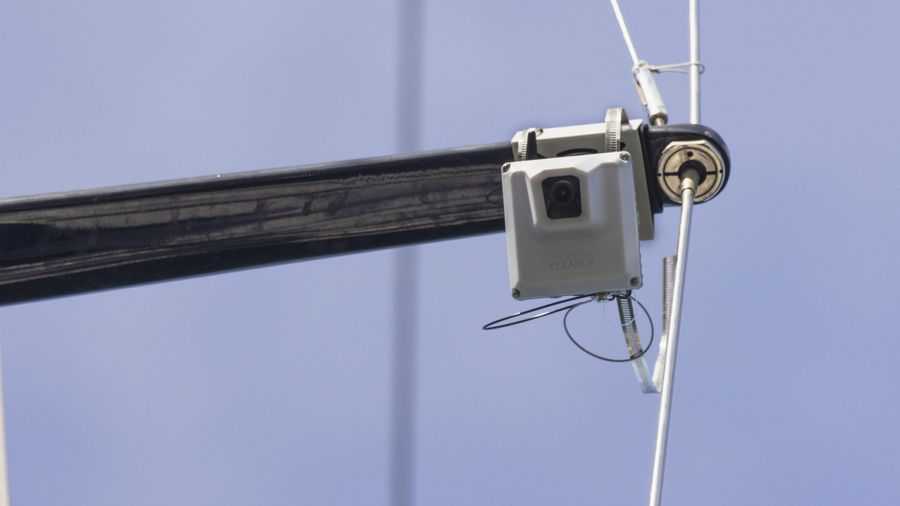
The expedition supported our Research team in two key areas of studying ocean plastic pollution: sailors tagged GPS buoys to megaplastics found at sea, allowing us to track their movement, and mounted ADIS on their boats to help localize plastic hotspots within the Great Pacific Garbage Patch.
Ocean Research Laboratory
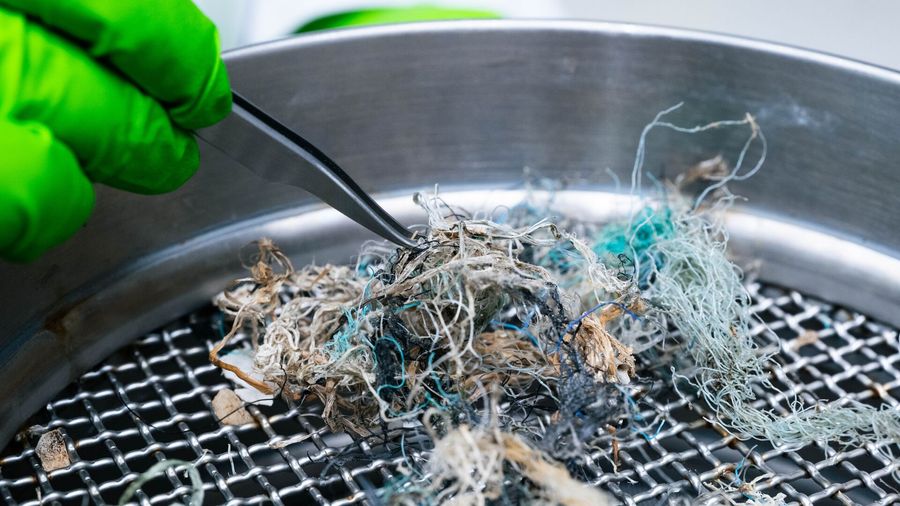
Once the ocean plastic was brought back to the Netherlands, it then needed to be counted, classified and analyzed.
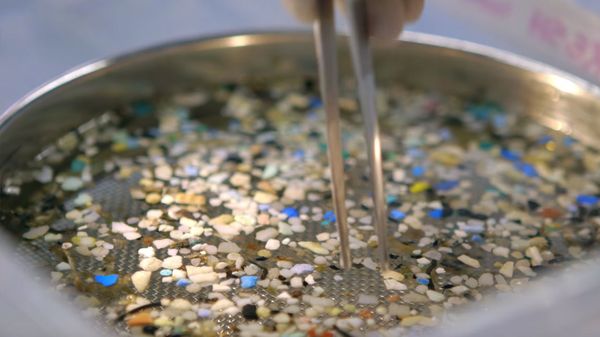
Counting and Classifying
The first step in analyzing the plastic was to quantify it – to turn this physical matter into data.
Every piece of plastic that was recovered was cleaned, counted and classified by size and type. In total, 1.2 million plastic samples were counted, one by one, and were used to further study the physical properties and toxicity of the plastic that floats in the GPGP.
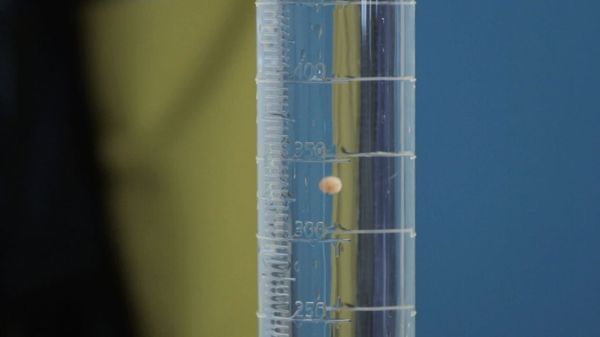
Understanding Physical Properties
Not only is the size and count of the plastic in the GPGP important to calculate, but the way in which the plastic interacts in the water helps the team learn more about the buoyancy and depths of the plastic.
To test this, various experiments were performed on the plastic in environments that were intended to replicate oceanic conditions and particularly salinity. Laboratory tests were conducted to measure the vertical speed of the plastic as it resurfaces.
Understanding Toxicity
It is commonly known that harmful PBT (Persistent Bio-accumulative Toxic) chemicals are found in ocean plastics, so researchers at The Ocean Cleanup tested plastic samples from the expeditions for their chemical levels. Their results helped them to realize what chemicals are present in the patch and what that means for animals feeding there.
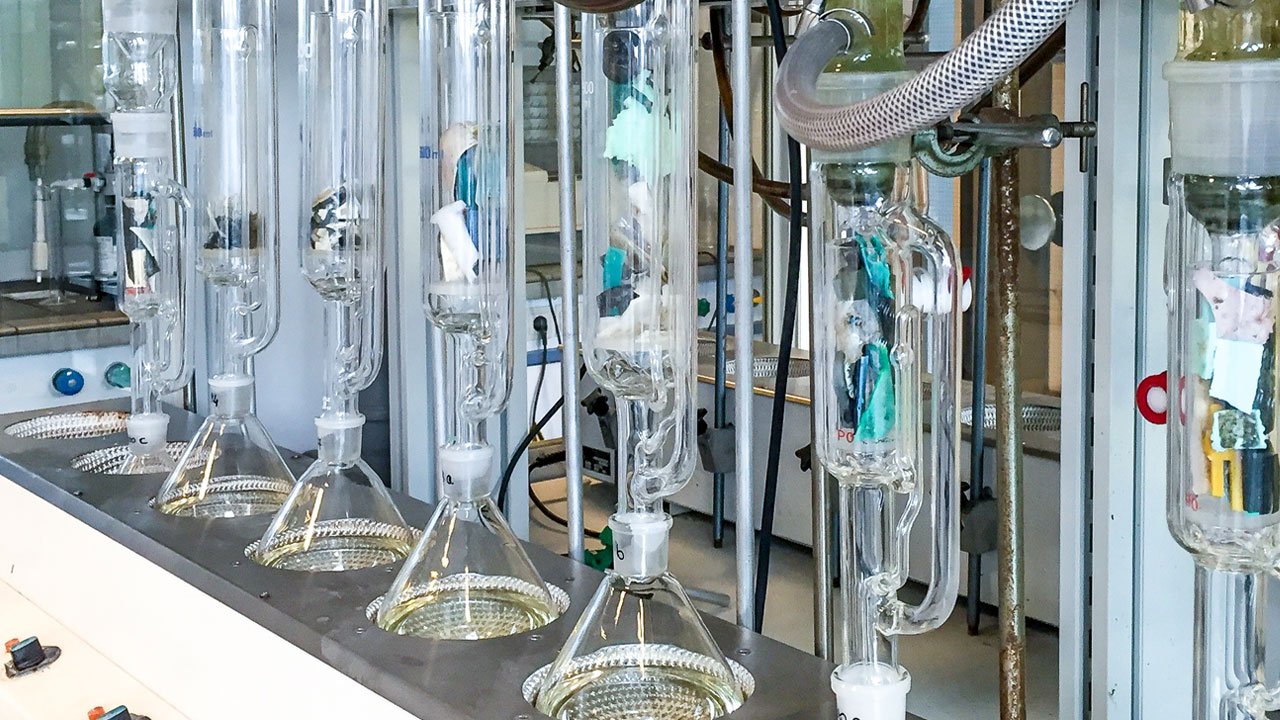 Plastics ranging from various type and size were analyzed by placing them in mixtures that would allow the various chemicals to be identified. A process known as Chromatography. They found through various tests that 84% of the plastics in the GPGP contain at least one type of PBT chemical.
Ocean Plastic Data Science
Numerous computational and mathematical processes and methods were used throughout the study of the GPGP, allowing the team to visualize and characterize many features of the patch and the plastic within it.
Turning Ocean Plastic into Data
When the manta trawls samples were captured and then brought on the vessel, several criteria were noted in the datasheets, including the date, duration, and final coordinates of each tow.
With this information, the team was able to identify the exact location where the plastic was retrieved. The location  and duration of all tows were confirmed during a post-processing phase by inspecting all the recorded datasheets against GPS trackers that were installed on all participating vessels. The total distance of tows, for example, combined with the net’s characteristics allowed the researchers to estimate the total surveyed surface.
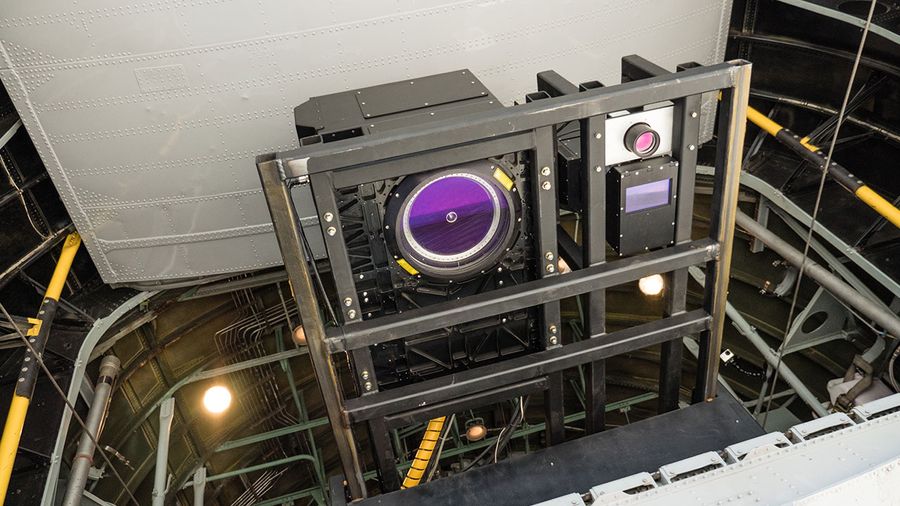
Process Aerial Expedition Data
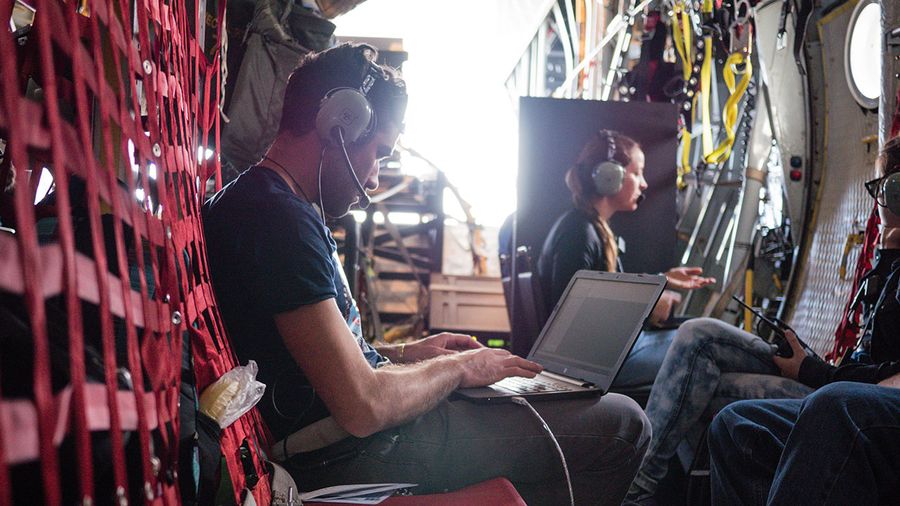
Aboard the C-130 Hercules aircraft used for the Aerial Expedition were three types of sensors: Lidar (an advanced active sensor that is similar to that used on Google’s autonomous cars), SWIR imager (an infrared camera to detect ocean plastic) and an RGB camera.
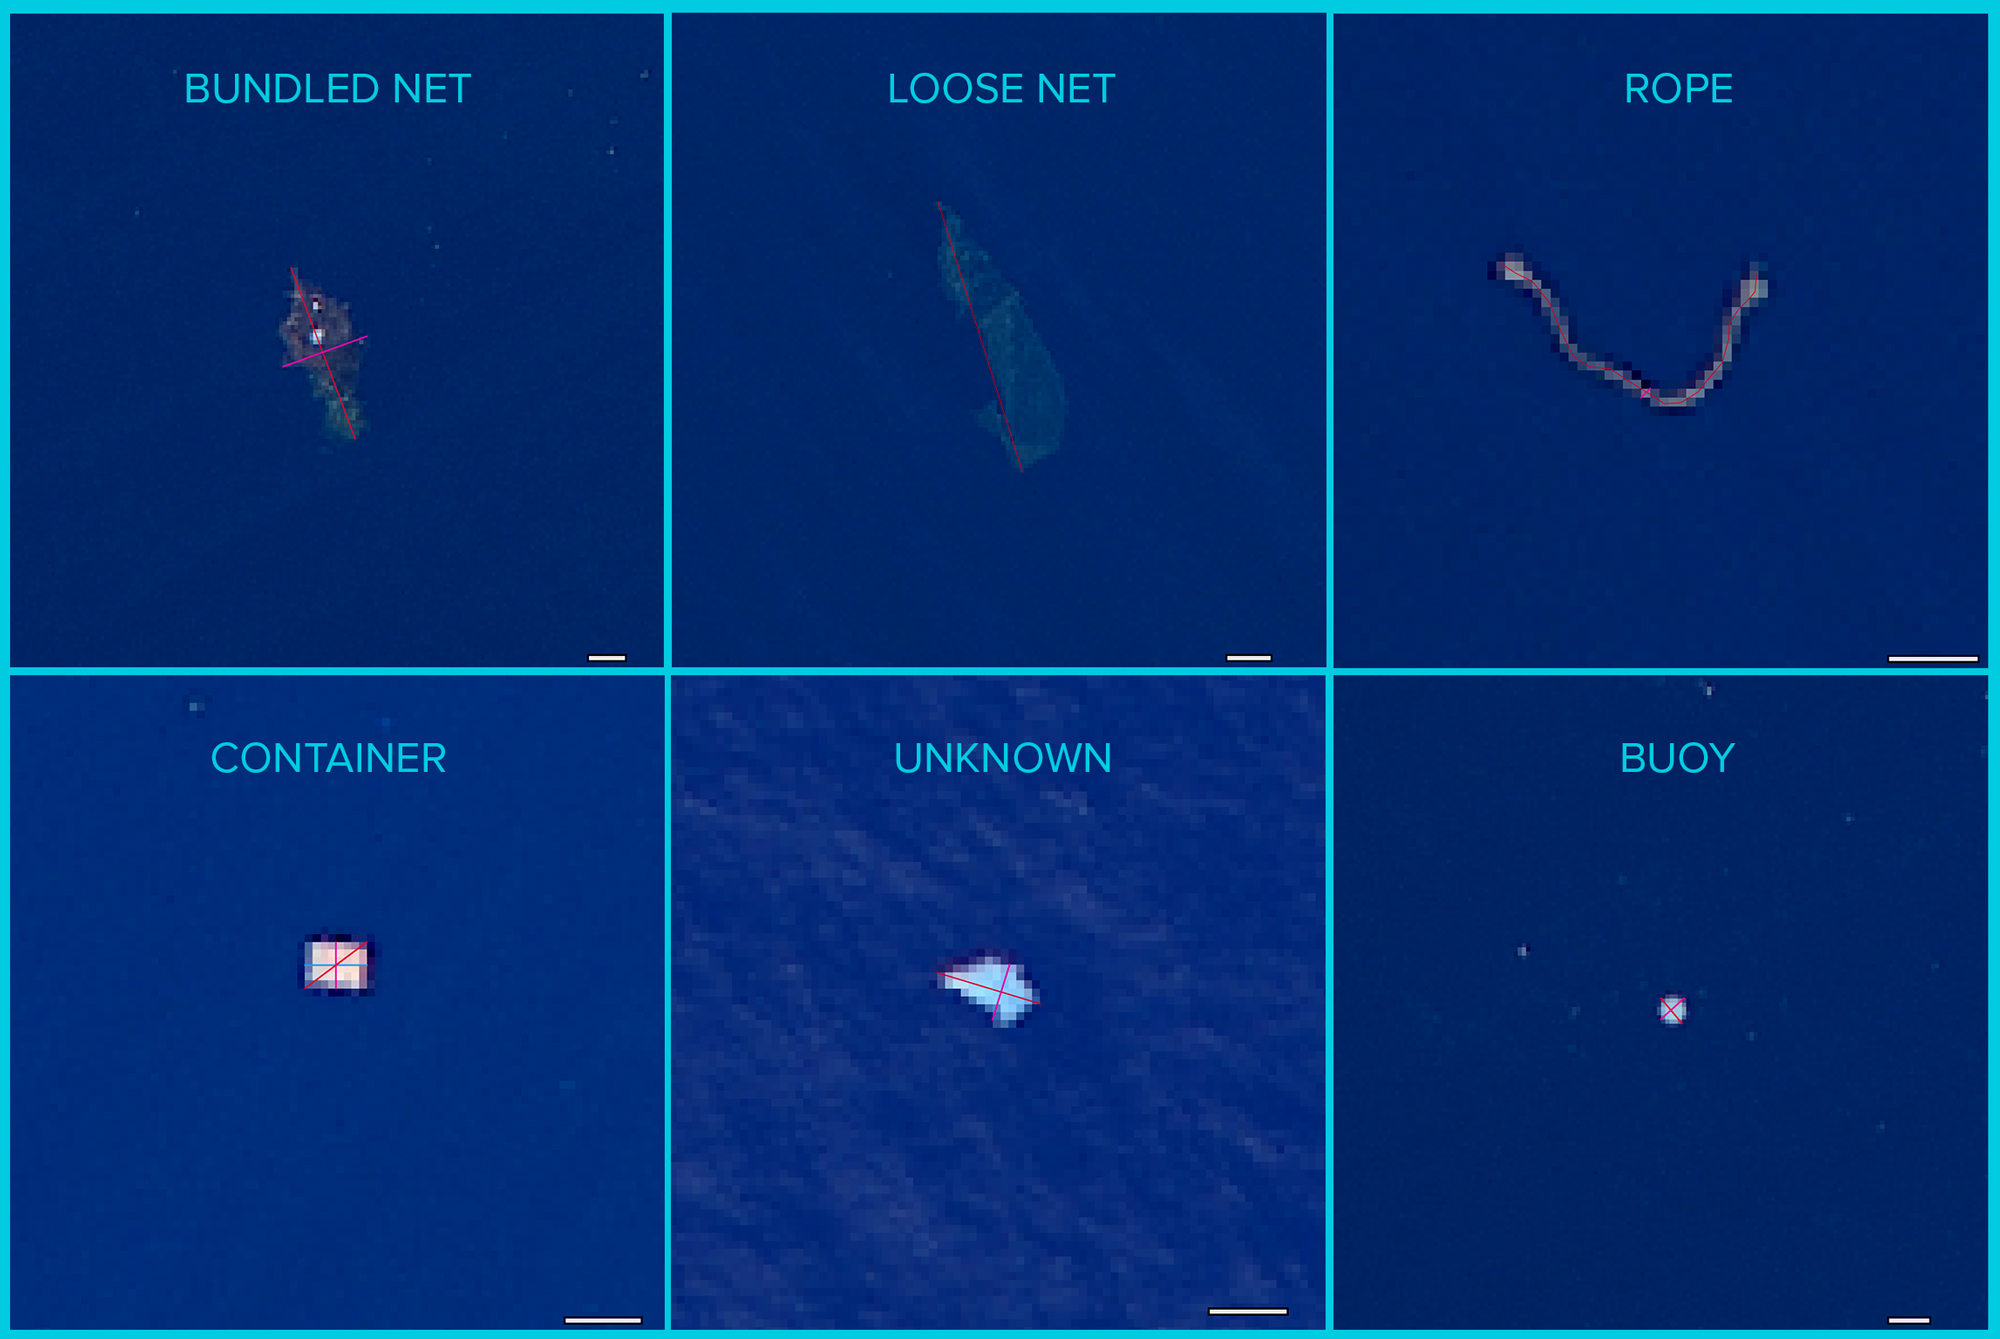
There were 3 sensor technicians, 7 navigation personnel and 10 researchers who helped track the plastic from above and monitor the equipment on board.
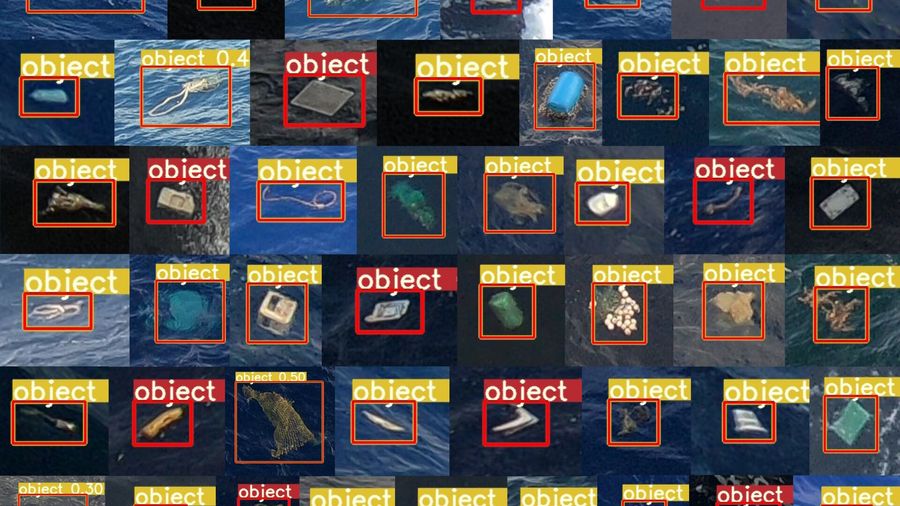
The data from this expedition were then analyzed and processed resulting in multispectral and geo-referenced imagery that was used to screen the surface area for plastic by trained observers and a machine-learning algorithm, providing spatial distribution of larger debris (>0.5m).
A Key to Convert Pixels into Kilograms
The mass of the plastic debris in the GPGP was calculated using imagery from the Aerial Expedition. By comparing the top view surface against dry mass of multiple objects collected during the first expedition at sea, including ghost nets, the team was able to make these estimations.
Merge all the Data into Comprehensive Computer Models
The data and imagery gathered from these objectives were eventually used by our team of computational modelers to build various models and computer-generated graphics. These served as a visual representation of the studies and tests that had been performed during the expeditions.
Research of this nature is crucial when understanding the many facets of the GPGP. These models have helped the engineers at The Ocean Cleanup to further improve the design of the cleanup system, which was deployed mid-2018.
We also use modeling to identify the pathways that bring plastic to the gyres. In 2022 our researchers published a new study based on over 6000 plastic objects (over 5 cm in size) captured in the GPGP by our System 001/B cleaning system in 2019. We then compared our field observations with our ‘virtual particle’ modeling results, allowing us to see the most statistically probable sources of GPGP plastic.
This indicated that over 75% of plastics in the GPGP – not only the 46% made up of fishing nets, as we discovered in 2018 – are attributable to offshore fishing activities. More research will be required in order to discover if this also applies to the other garbage patches around the world.