River plastic emissions to the world’s oceans
Rivers are a major source of plastic waste in the oceans. We estimate that 1000 rivers, represented by the red dots, are accountable for nearly 80% of global annual riverine plastic emissions, which range between 0.8 – 2.7 million metric tons per year, with small urban rivers amongst the most polluting. The remaining 20% of plastic emissions are distributed over 30,000 rivers, represented by smaller blue dots.
Our findings displayed in this map have been published in the journal Science Advances. The point file that contains the locations of the rivers and their modeled plastic emissions can be downloaded from figshare. The results can assist others in prioritizing, developing, and implementing mitigation measures and strategies.
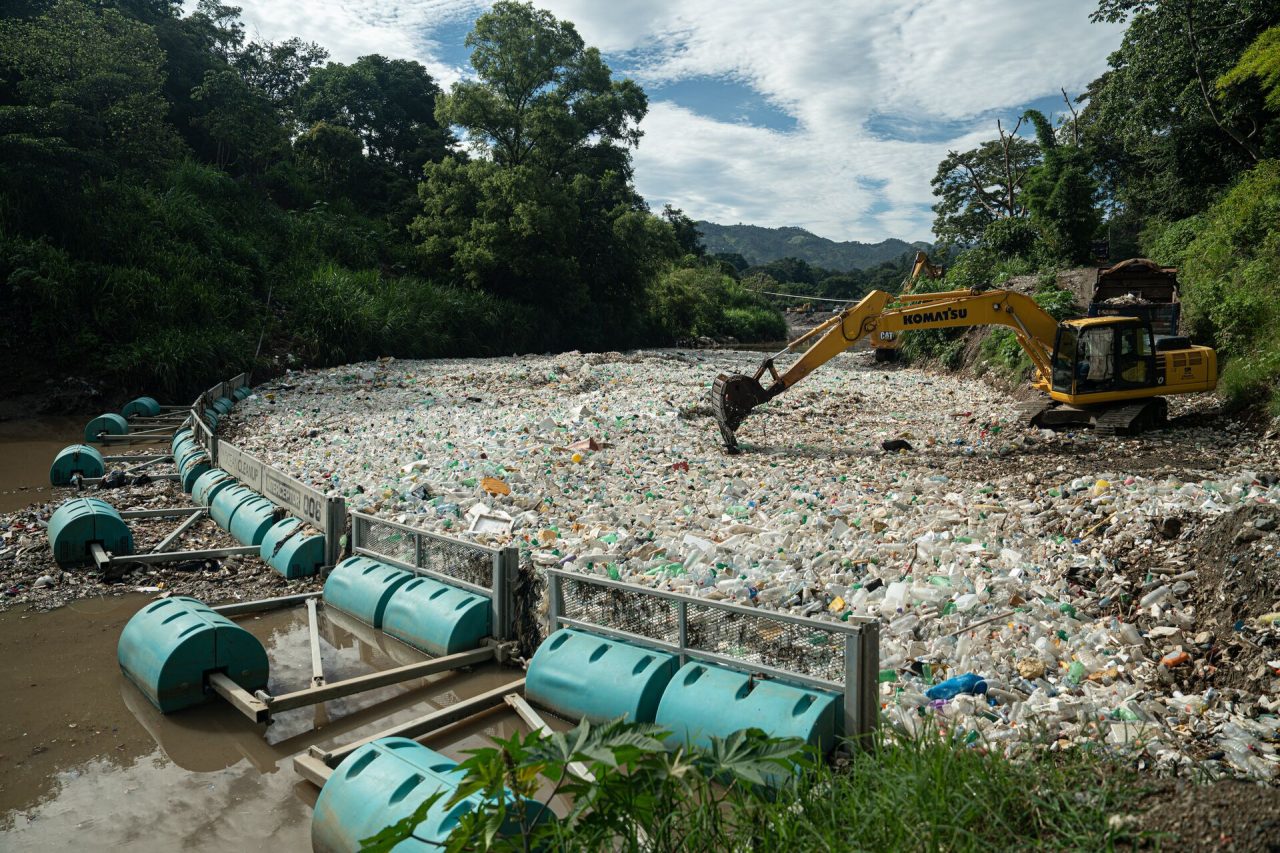
The Ocean Cleanup has developed Interceptor solutions, including the Interceptor™, to help combat river plastic entering the world’s oceans.
Working together with government leaders, private corporations, and the scientific community, we aim to tackle these 1000 most polluting rivers, offering our technology, experience, knowledge and network.
Our new model approach includes geographically distributed data on plastic waste, land use, wind, precipitation, and rivers. The updated model then calculates the probability for plastic waste to reach a river and subsequently the ocean.
This probabilistic approach highlights regions that are likely to emit plastic into the ocean. Combined with mismanaged plastic waste, displayed in this map, our model predicts plastic emissions for each river. Detailed information on our modeling approach and data will follow in our scientific update.