
Quantifying global plastic inputs from rivers into oceans
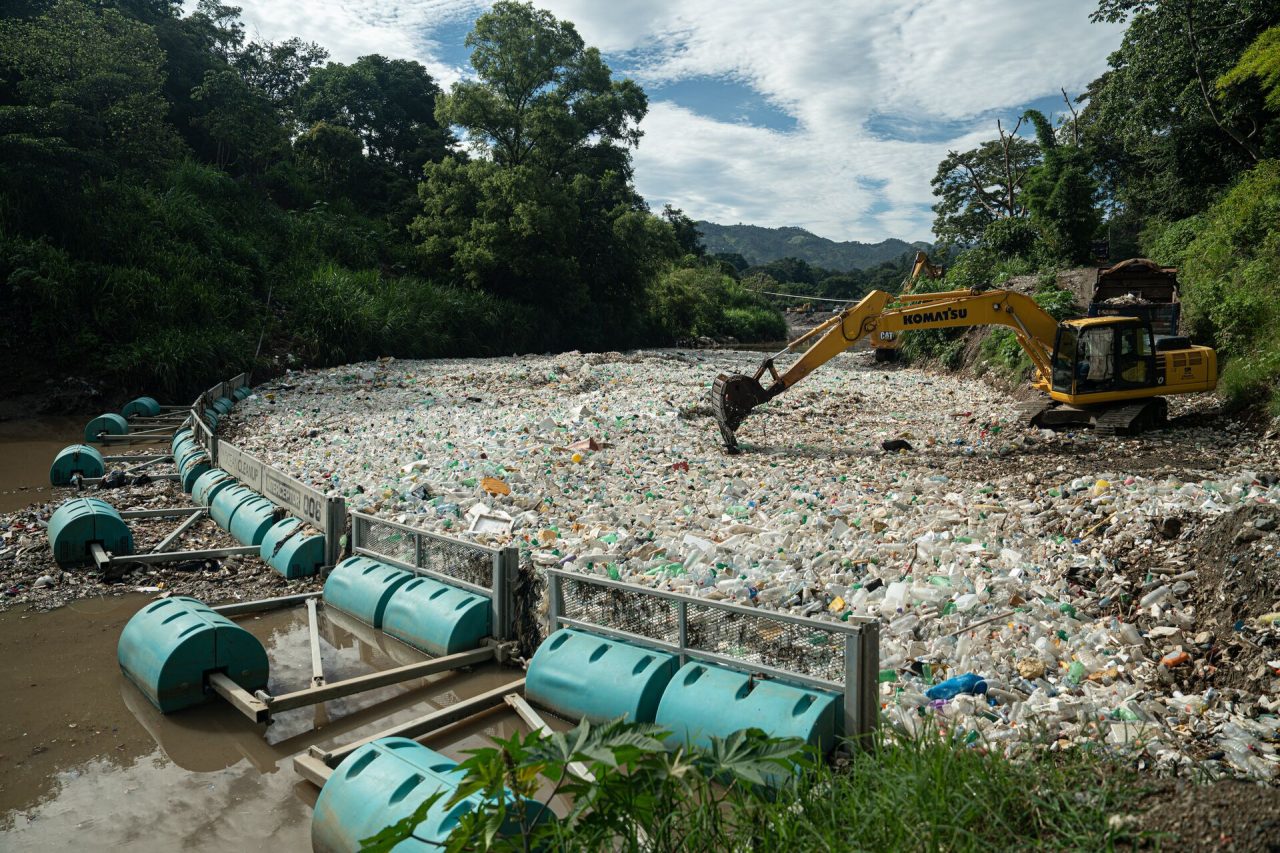
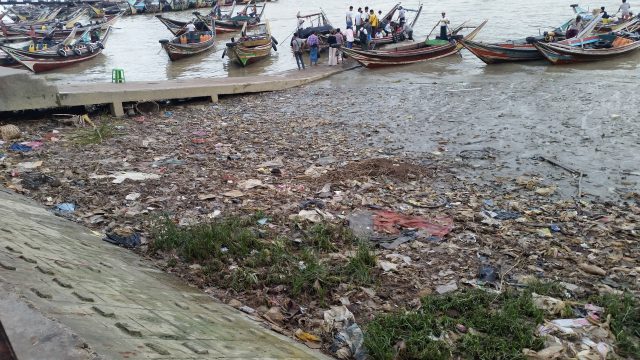
Back to updatesQuantifying plastic pollution in the world’s ocean requires a good understanding of sources. It is commonly accepted that most plastic found in or near the marine environment is coming from land-based sources. Rivers particularly may play an important role in transporting mismanaged plastic waste from land into the ocean.
Our study, published today in Nature Communications suggests that the global riverine system is contributing between 1.15 and 2.41 million metric tons per year of plastic waste into the world’s ocean. We found that two-thirds of this input was generated by the top 20 most polluting rivers and that these were mostly located on the Asian continent.
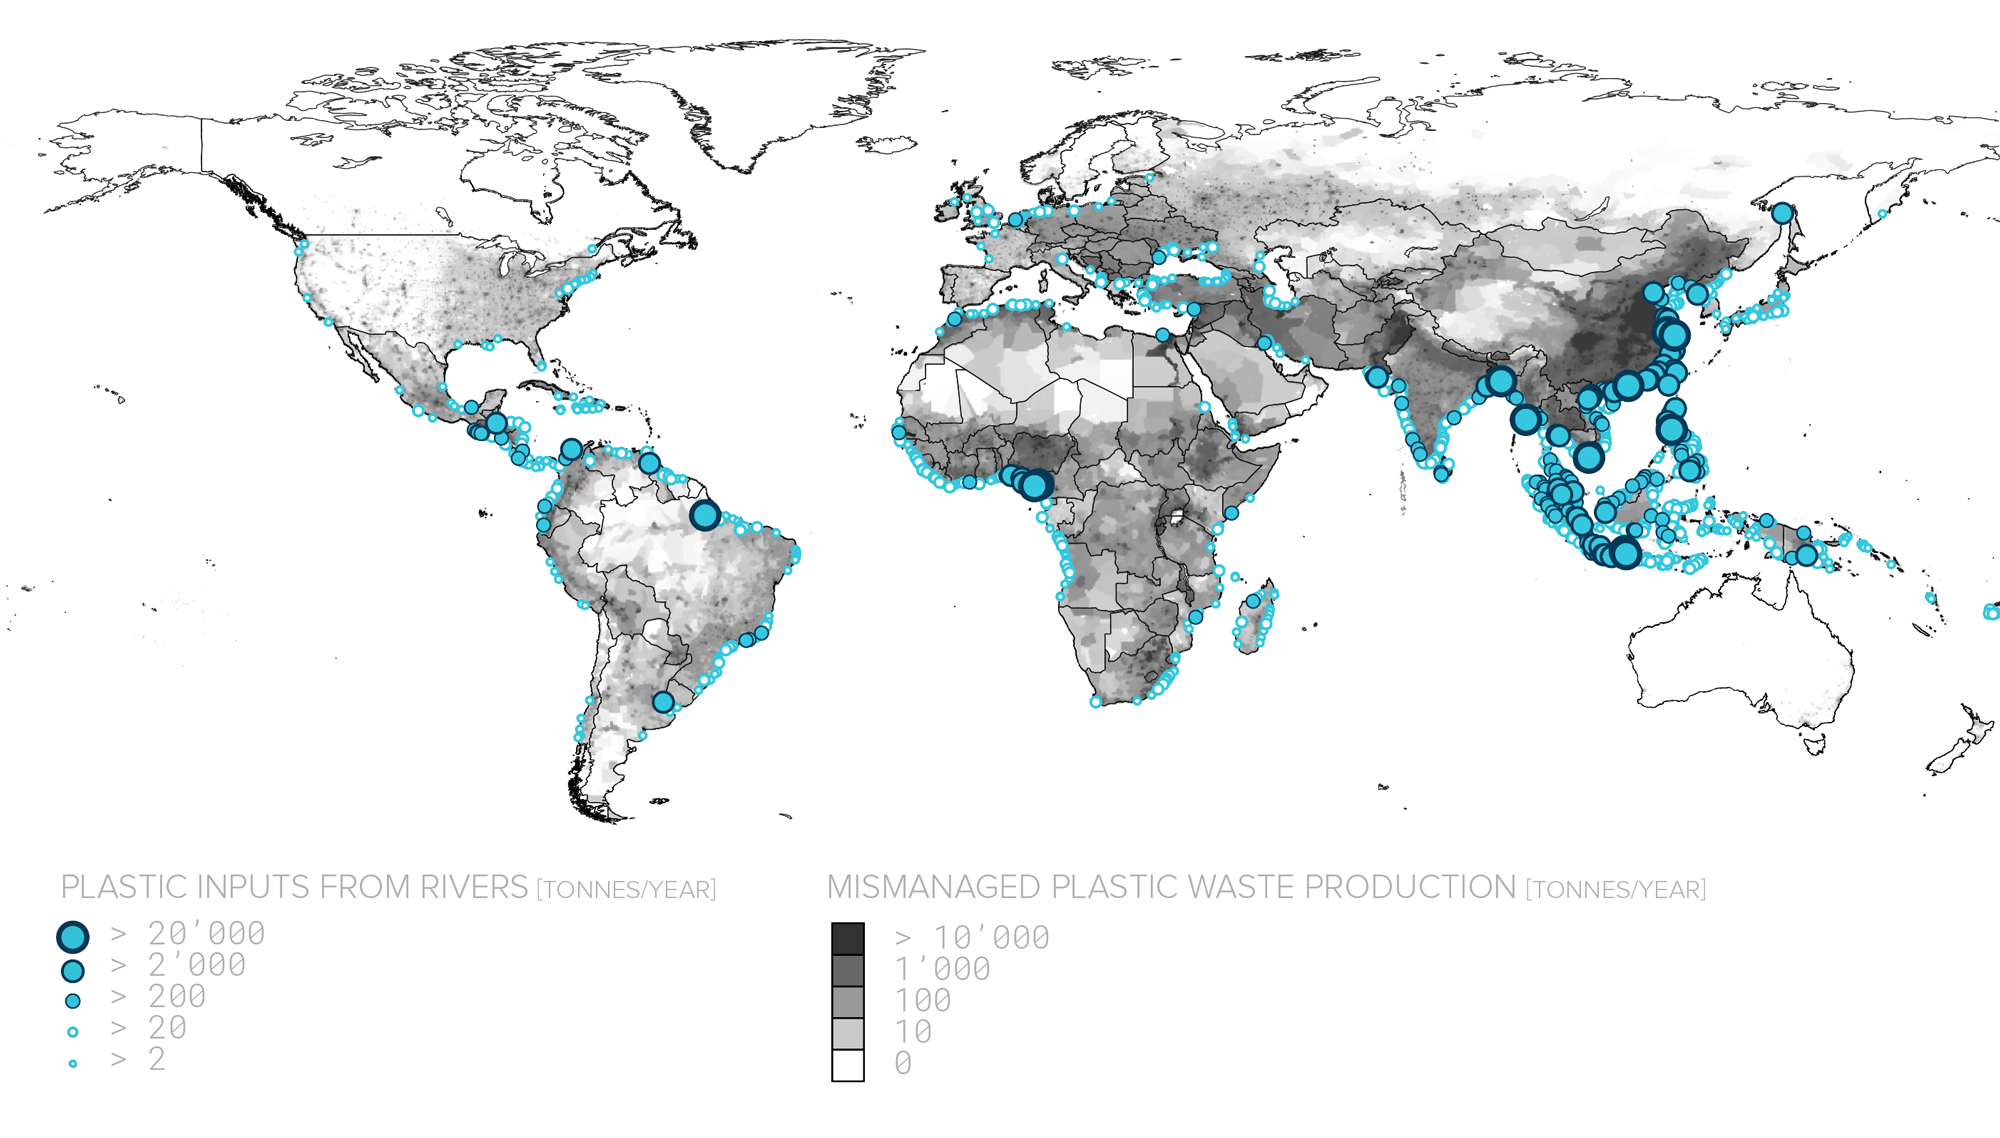
A GLOBAL MODEL FOR RIVER PLASTICS
Plastic in freshwater environment has been reported in lakes and rivers worldwide. However, levels of contamination vary by several orders of magnitude between rivers. We asked ourselves if these variations could be explained by the geography and the hydrography of the different rivers. We compiled geospatial information on population density, waste management, topography, hydrography and locations of dams worldwide. We compared our geospatial dataset with plastic concentration data reported in the scientific literature in rivers of four different continents. The different contamination levels demonstrated a strong correlation with population density, mismanaged plastic waste production, and catchment runoff. We formulated an empirical equation based on these indicators and calibrated our model against field measurement data. As we successfully reproduced observations for various rivers across the world, we used our calibrated model to draw a global picture of yearly inputs of plastic from rivers into oceans.
UNDERSTANDING THE SEASONALITY OF INPUTS
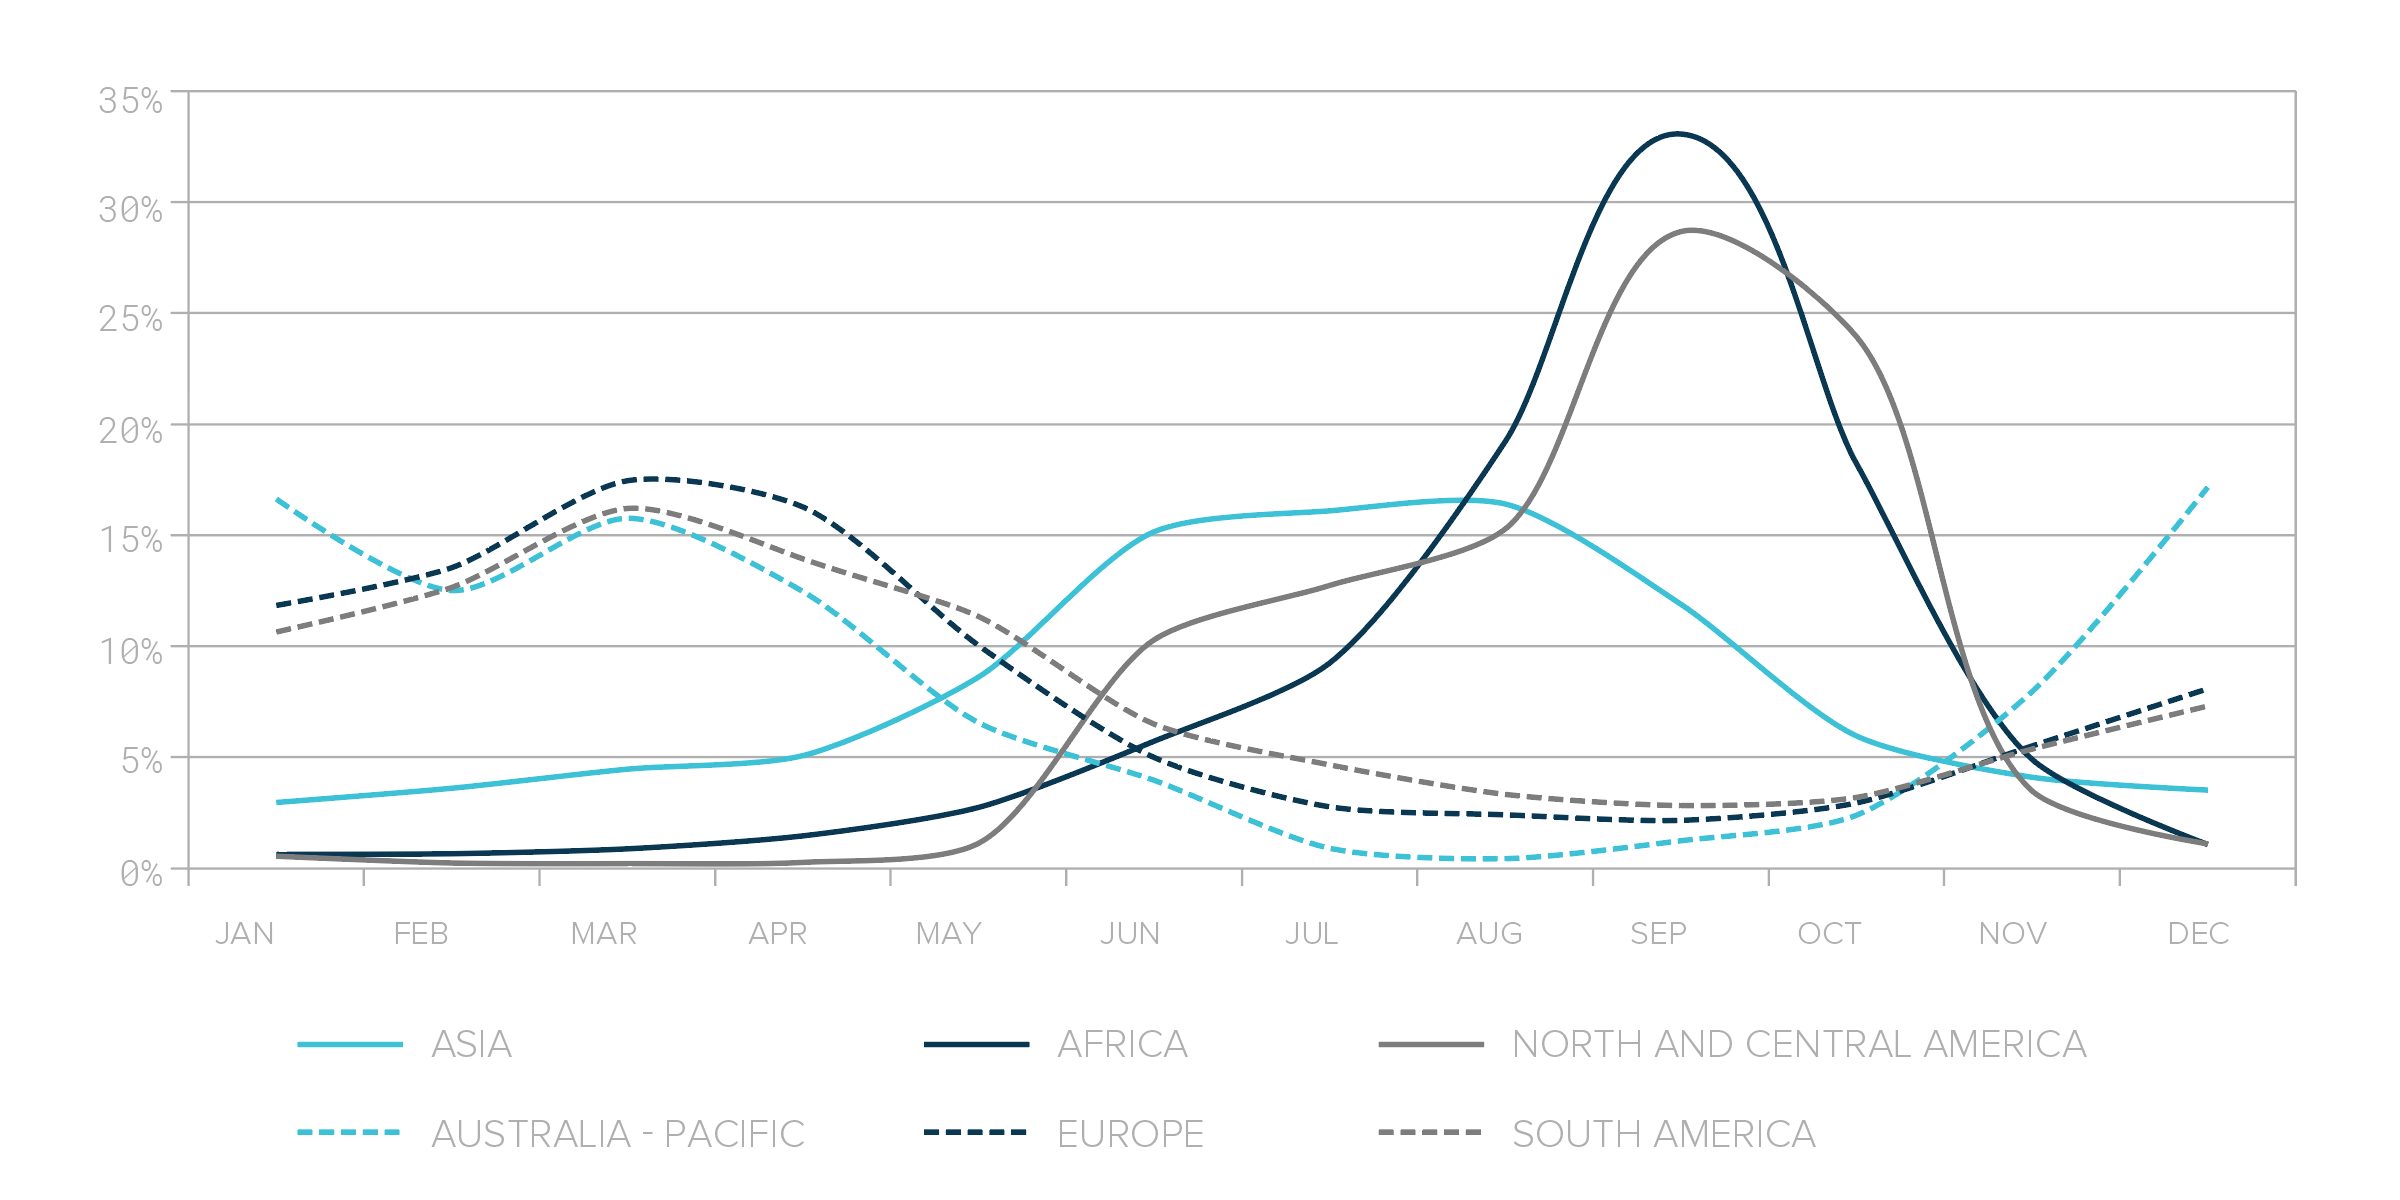
One important finding of our study is that plastic inputs from rivers vary between seasons and is highly correlated with catchment runoff. Surface catchment runoff is a function of several parameters such as rainfall, evaporation or ground permeability. Therefore, seasonal weather patterns influence the rates of inputs at a regional scale. For instance, we found that inputs from the Asian continent were balanced throughout the year between the East Asian monsoon over the continent from June to September and the South East Asian monsoon in Indonesia between November and March. Other continents also show different rates of input depending on the time of the year. Maximum inputs for Europe, South America, and Australia Pacific region occur from December to May while Africa, Central, and North America contribute more significantly from June to November.
Solving the spatial and temporal variability of sources is key to understand the global marine plastic pollution issue. Our results are currently used in the input of our oceanic dispersal models. Our data and framework are publicly available to assist the community in prioritizing monitoring and in designing mitigation policies.