
The Testing Continues
Back to updatesSticking to its planning, The Ocean Cleanup team is working hard on its long-term goal to initiate the full-scale cleanup of the Great Pacific Garbage Patch by 2020. To ensure optimization of our technology, we test and evaluate the barriers’ capability and survivability in multiple ways. Among others, we investigate how the barrier reacts to multiple conditions to forecast the behavior of the barrier in the ocean. Given the cost of a full-scale or even reduced scale tests, it is highly beneficial to develop computer models to test different boom designs, assess their dynamics and measure their capture efficiency.
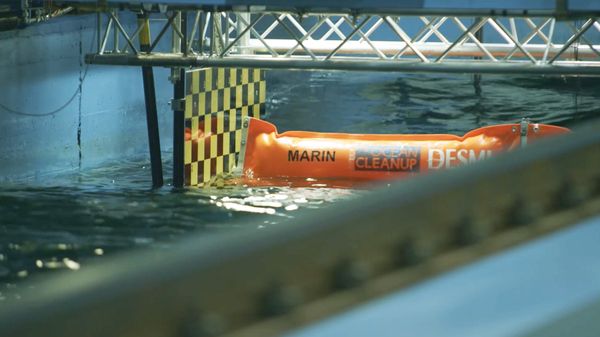
Our computer models are validated by matching the scale model as precisely as possible, allowing us to extrapolate the barriers’ behavior in complex situations and test multiple designs. Highlighted below is one of many tests conducted at world-class, research facility MARIN (Maritime Research Institute Netherlands) to optimize computational models and the barrier.
TESTING AT MARIN: WHAT ARE WE INVESTIGATING AND WHY?
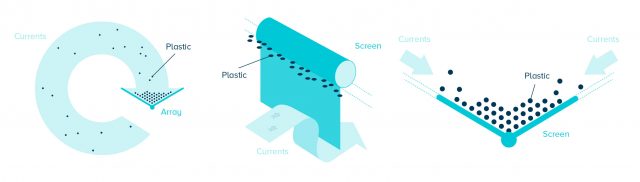
Our team needs to ensure The Ocean Cleanup technology will collect as much ocean plastic as possible. To achieve this, we study the interaction between plastic and the barrier in model experiments. The plastic spheres in this test were calibrated by being filled with fresh or salt water at different densities to match the rising velocity that we determined by means of actual samples of plastic debris collected during our Mega Expedition.
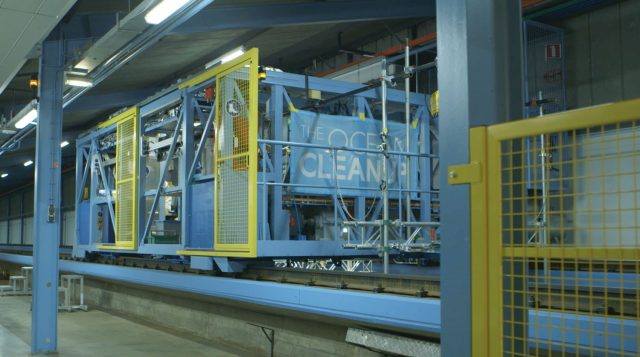
In the Concept Basin, the currents and wave heights were precisely selected and set per test. Four cameras were placed around the moving carriage to observe the behavior of all tested particles from multiple angles. The cameras allowed us to analyze if the plastic was caught by the barrier or entrained, how it became entrained and how it behaved after it was entrained. Further measurements included: pressure on the barrier’s skirt with 10 sensors oriented upstream, tension in the springs, and acceleration at the top and bottom of the boom.
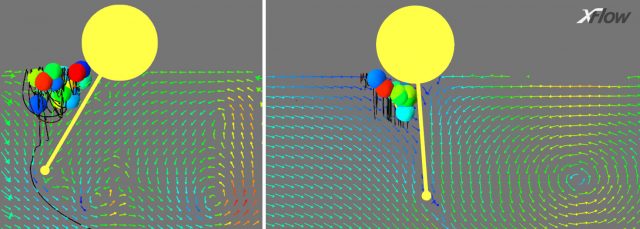
We continued iterations to match test conditions and outcomes in both scale model and computer model until the team established the required level of correlation between the two. With the increased understanding of the interaction between plastic and the barrier under a wide variety of conditions that we have developed, we can now accurately forecast the behavior of the real system based on our computer model.
The outcome of these tests will allow our engineering team to perfect our barrier design. The reliability of our models will significantly help to evaluate the barriers’ capture efficiency in full-scale conditions and helps us move forward towards the deployment of our first pilot system.